Use the Content Pack for Third-party APM
Once you install the Content Pack for Third-party APM in your environment, and configure any required add-ons for third-party data collection, you can begin using the content pack and start monitoring application performance. The content pack contains several views and dashboards that provide visibility into the different metrics of your applications.
Monitor your applications' overall performance
The content pack includes three glass tables that you can use to monitor application performance at a high level. Select Glass Tables from the ITSI menu and select a glass table to view. From the Edit menu you can edit or clone the glass table to customize it.
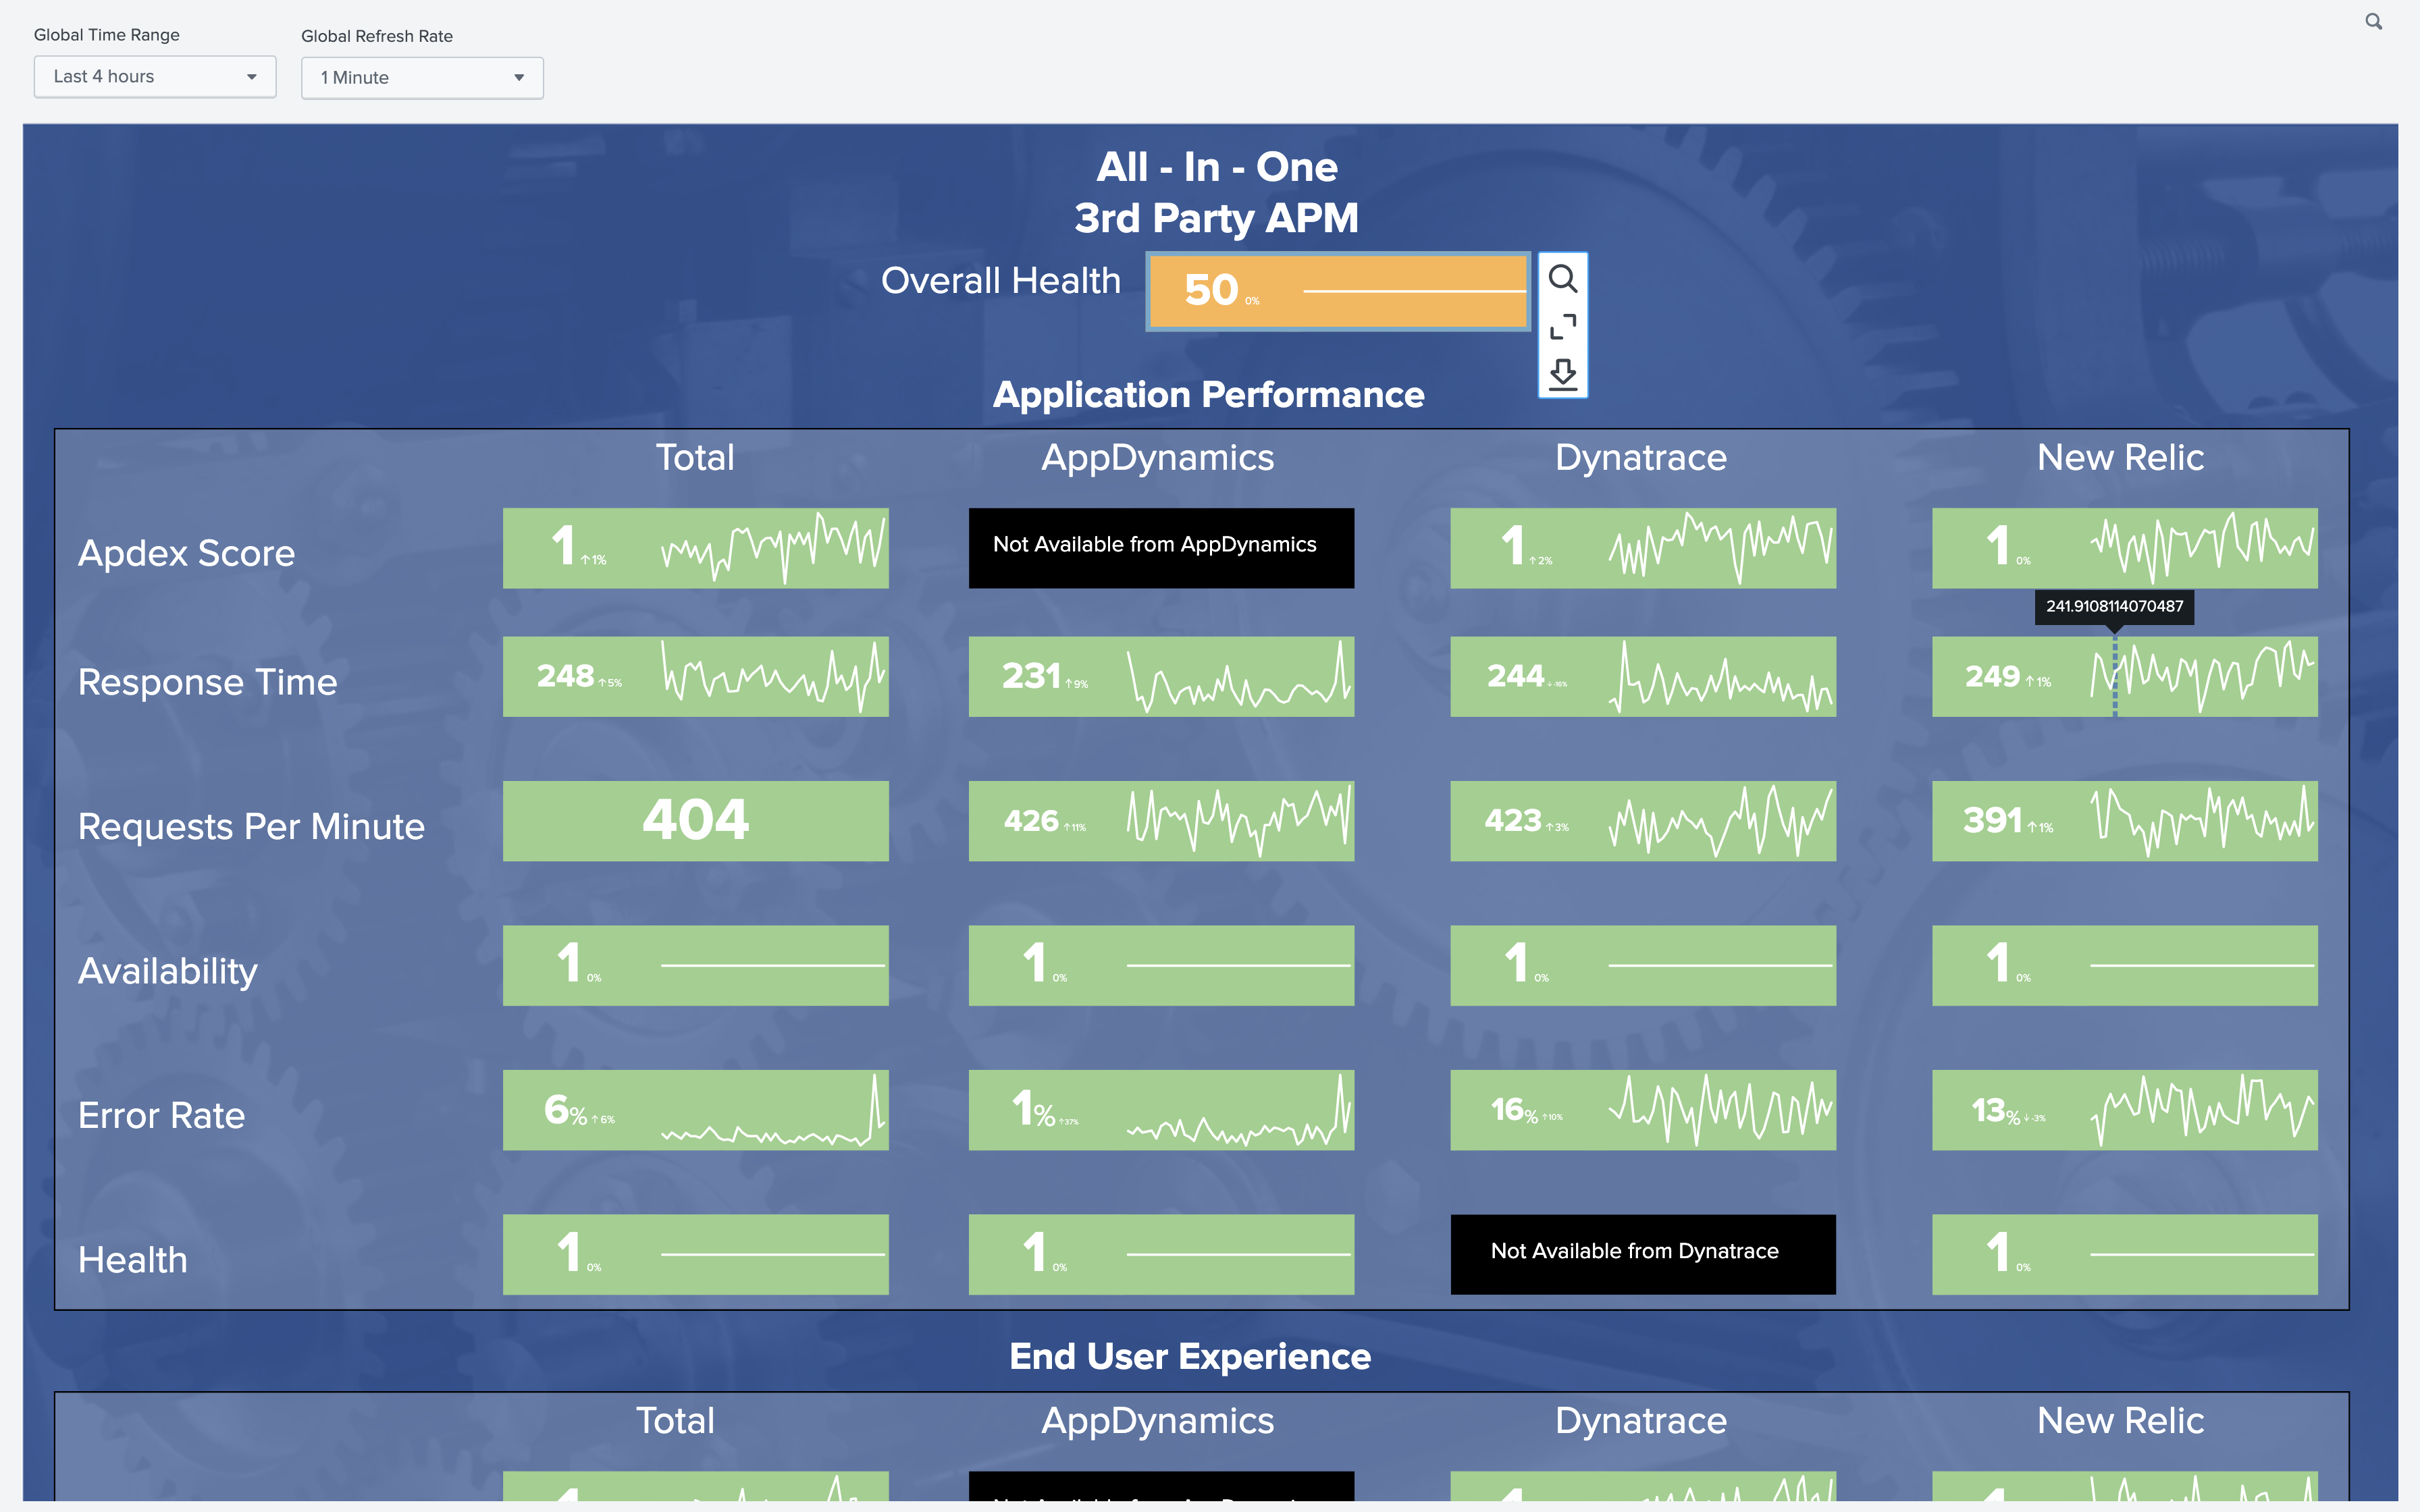
All-In-One Glass Table
Use the All-In-One glass table to monitor KPIs across all of the third-party vendors in one place. Services are broken down into Application Performance services and End-User Experience services.
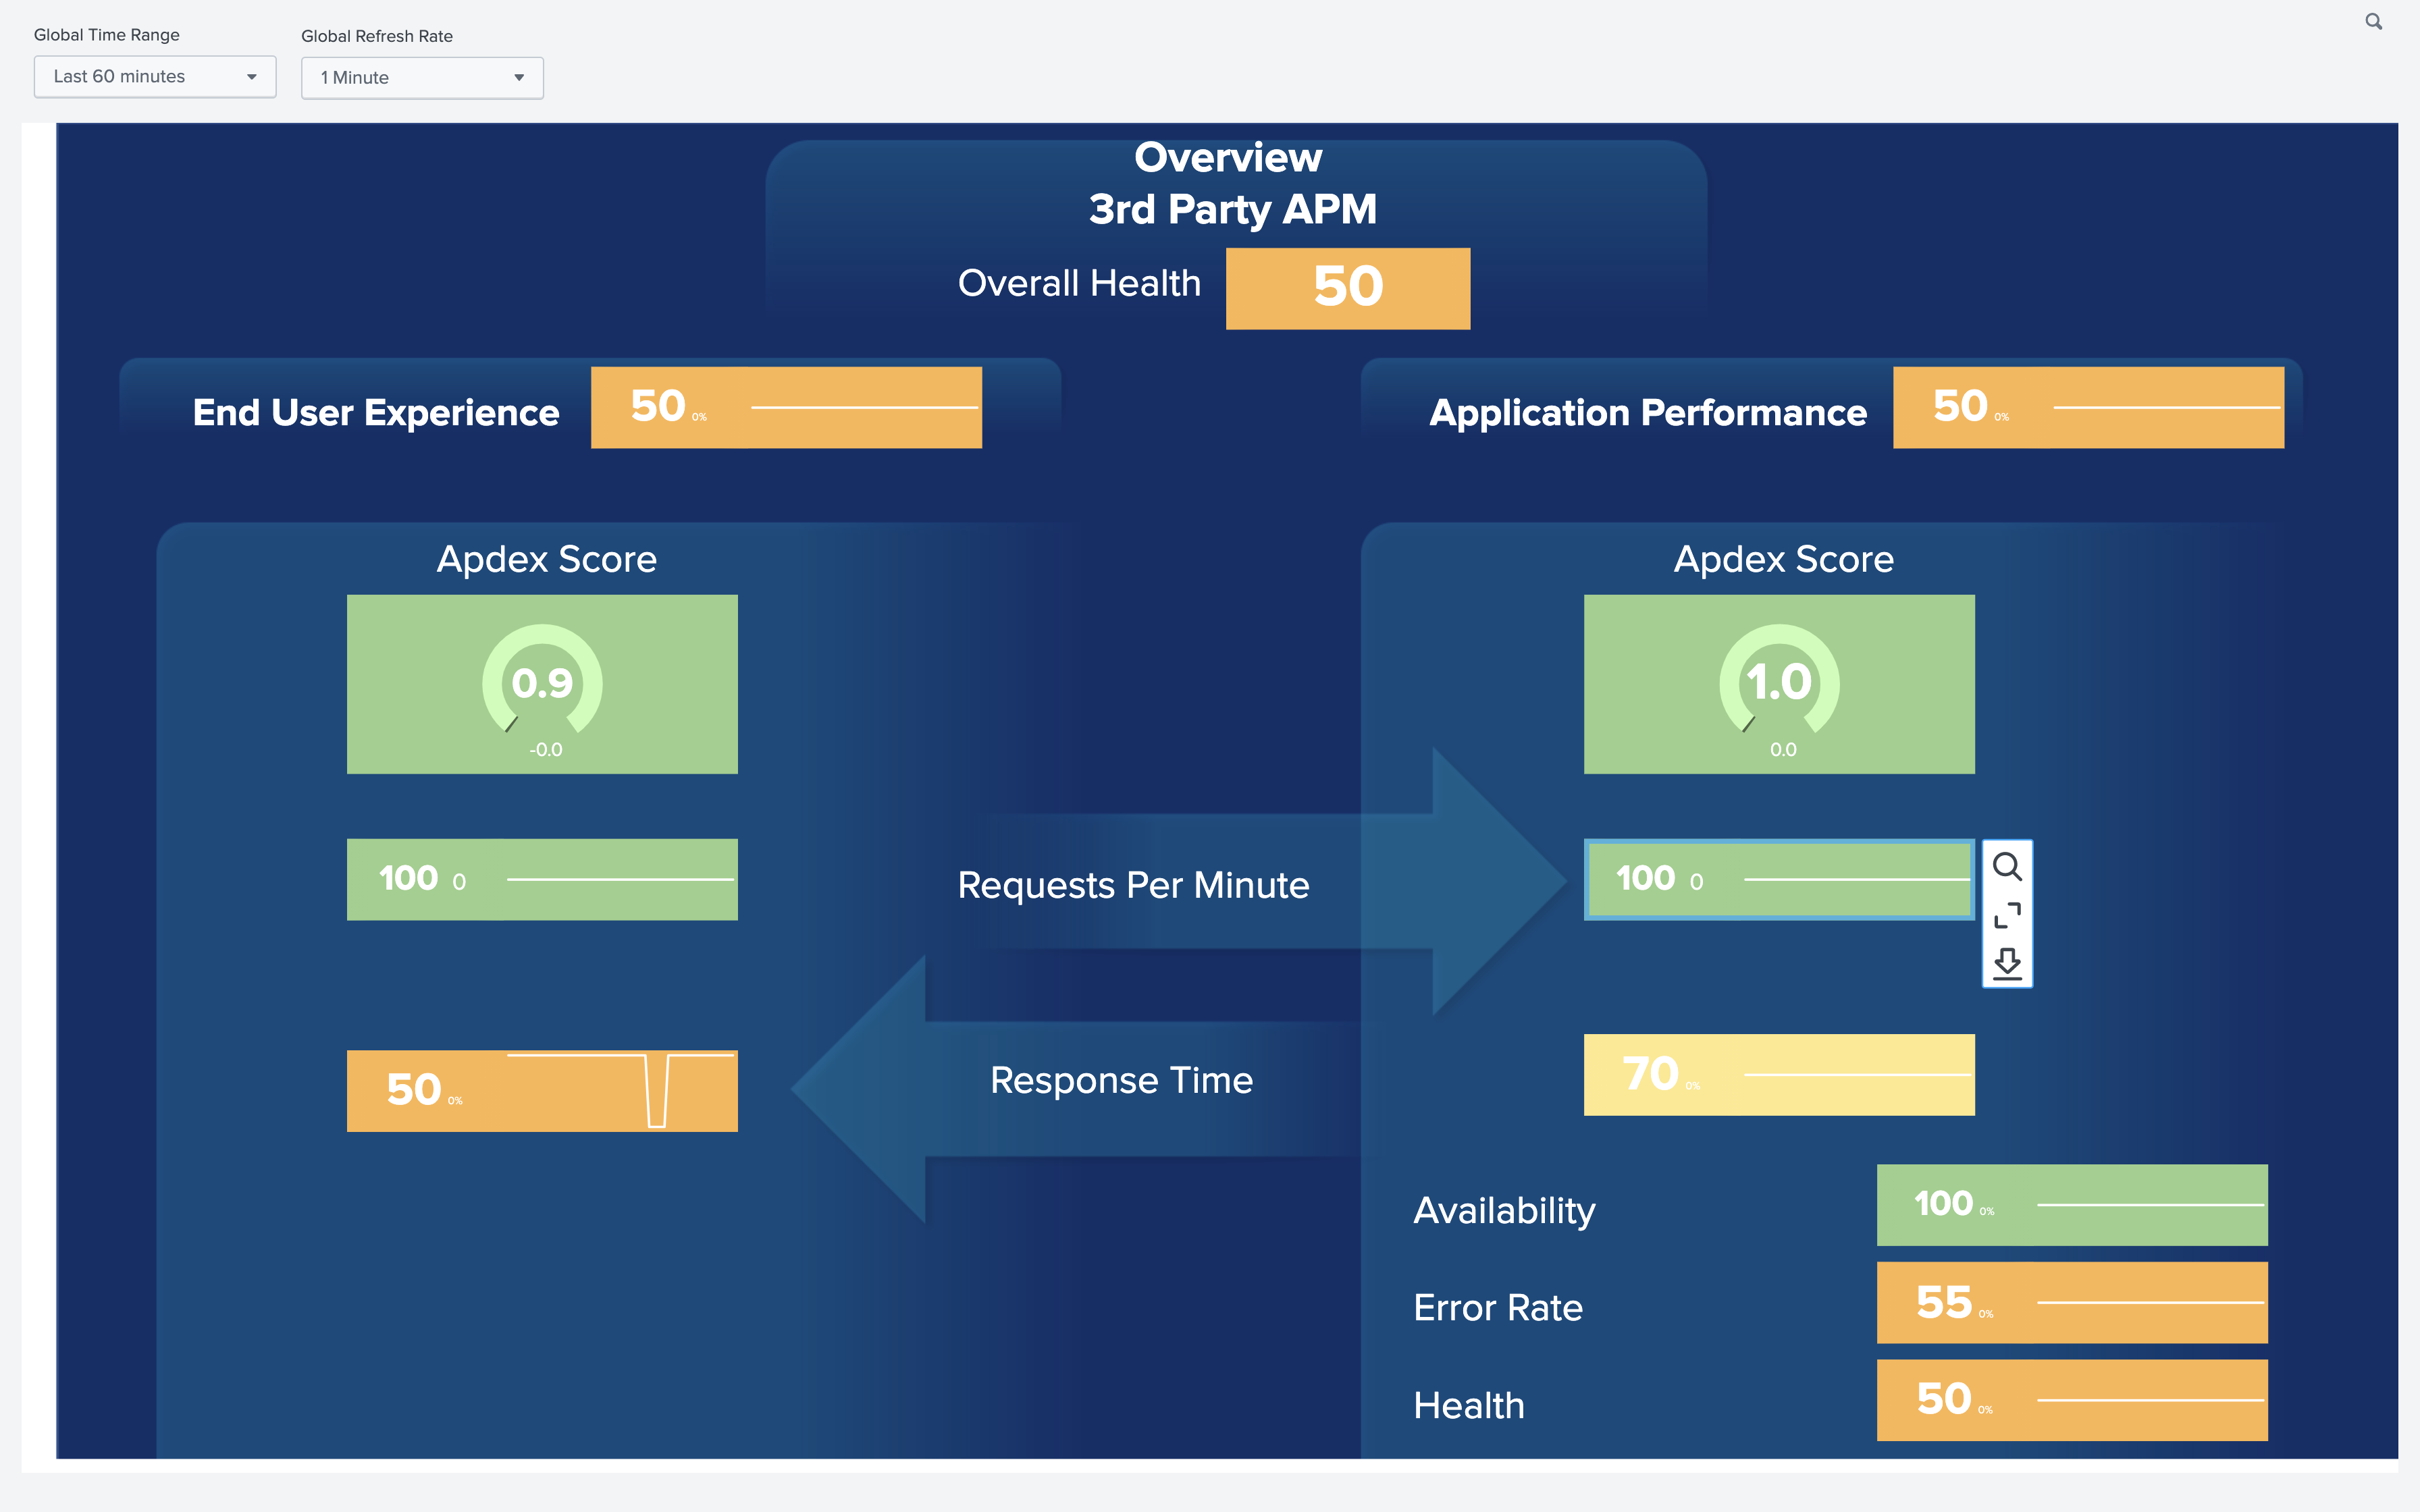
Overview Glass Table
Use the Overview Glass Table to monitor the combined metrics for Application Performance services and End User Experience services. You can click any metric to navigate to the Service Analyzer view and to review the KPIs that roll up to the metric in the glass table.
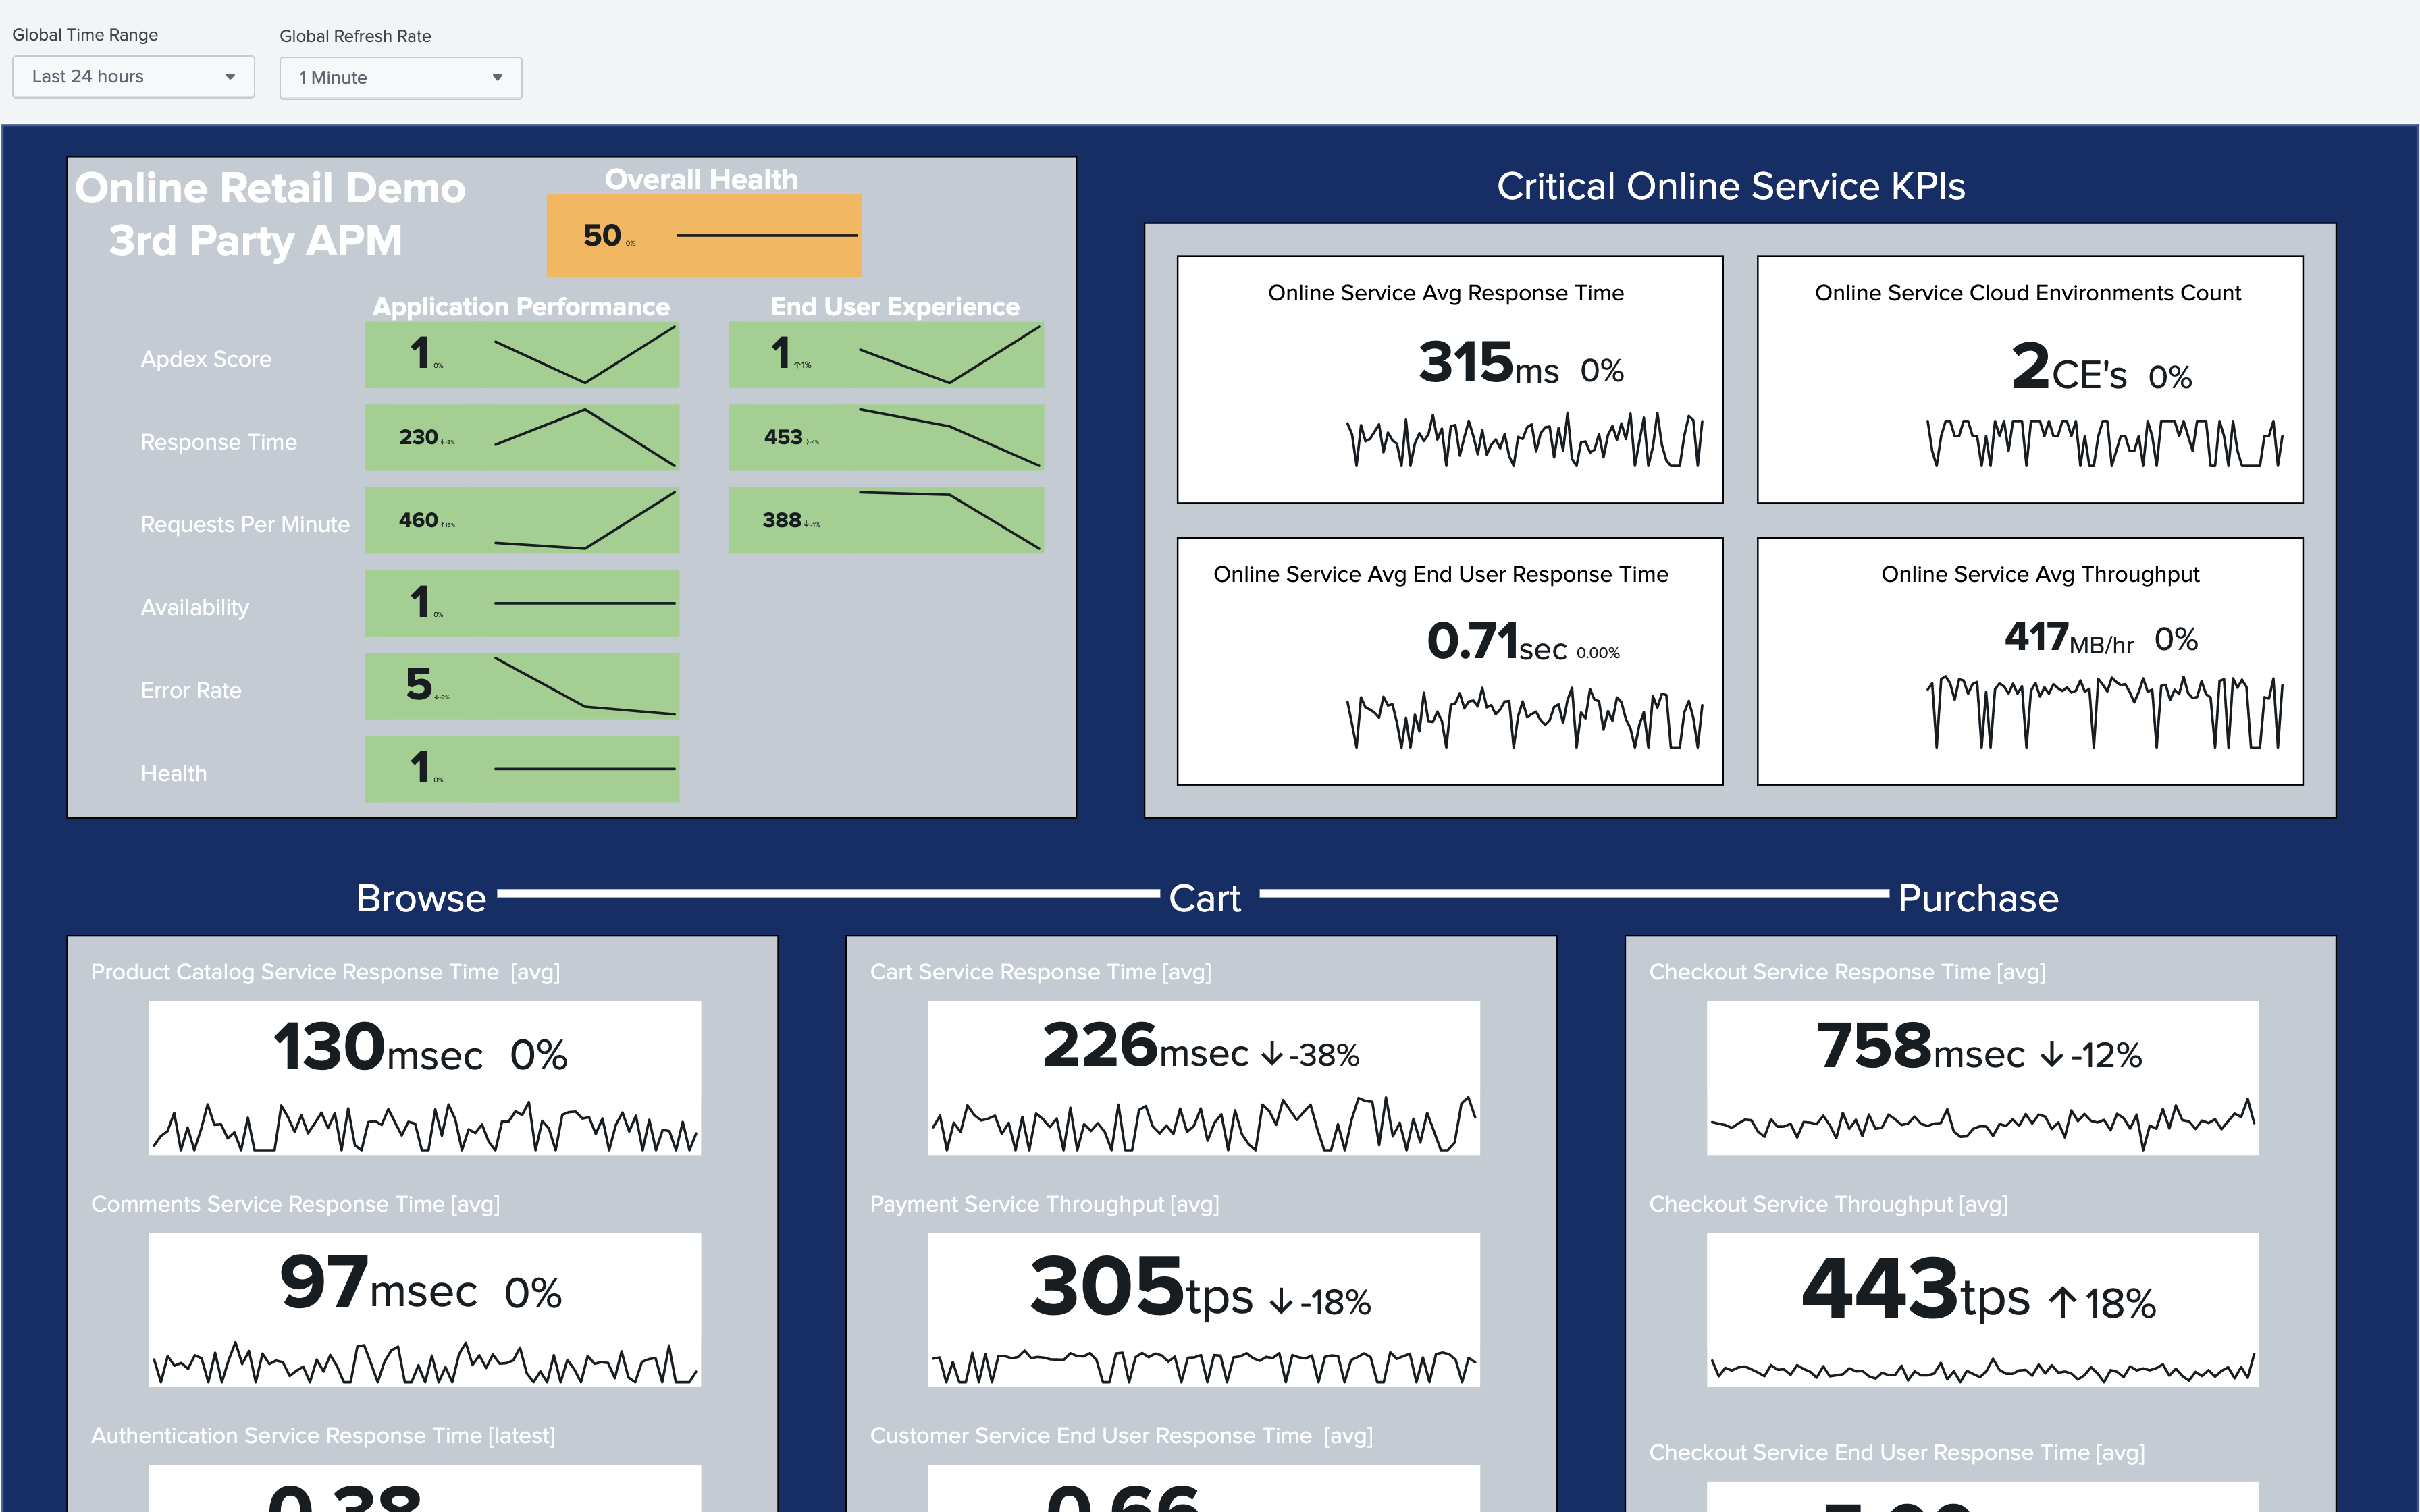
APM Online Retail Demo Glass Table
The APM Online Retail Demo Glass Table offers four critical online service KPIs to help you to monitor an online retail application. Use the Global Time Range and Global Refresh Rate menus at the top of the page to filter the results that displays.
Monitor your application services
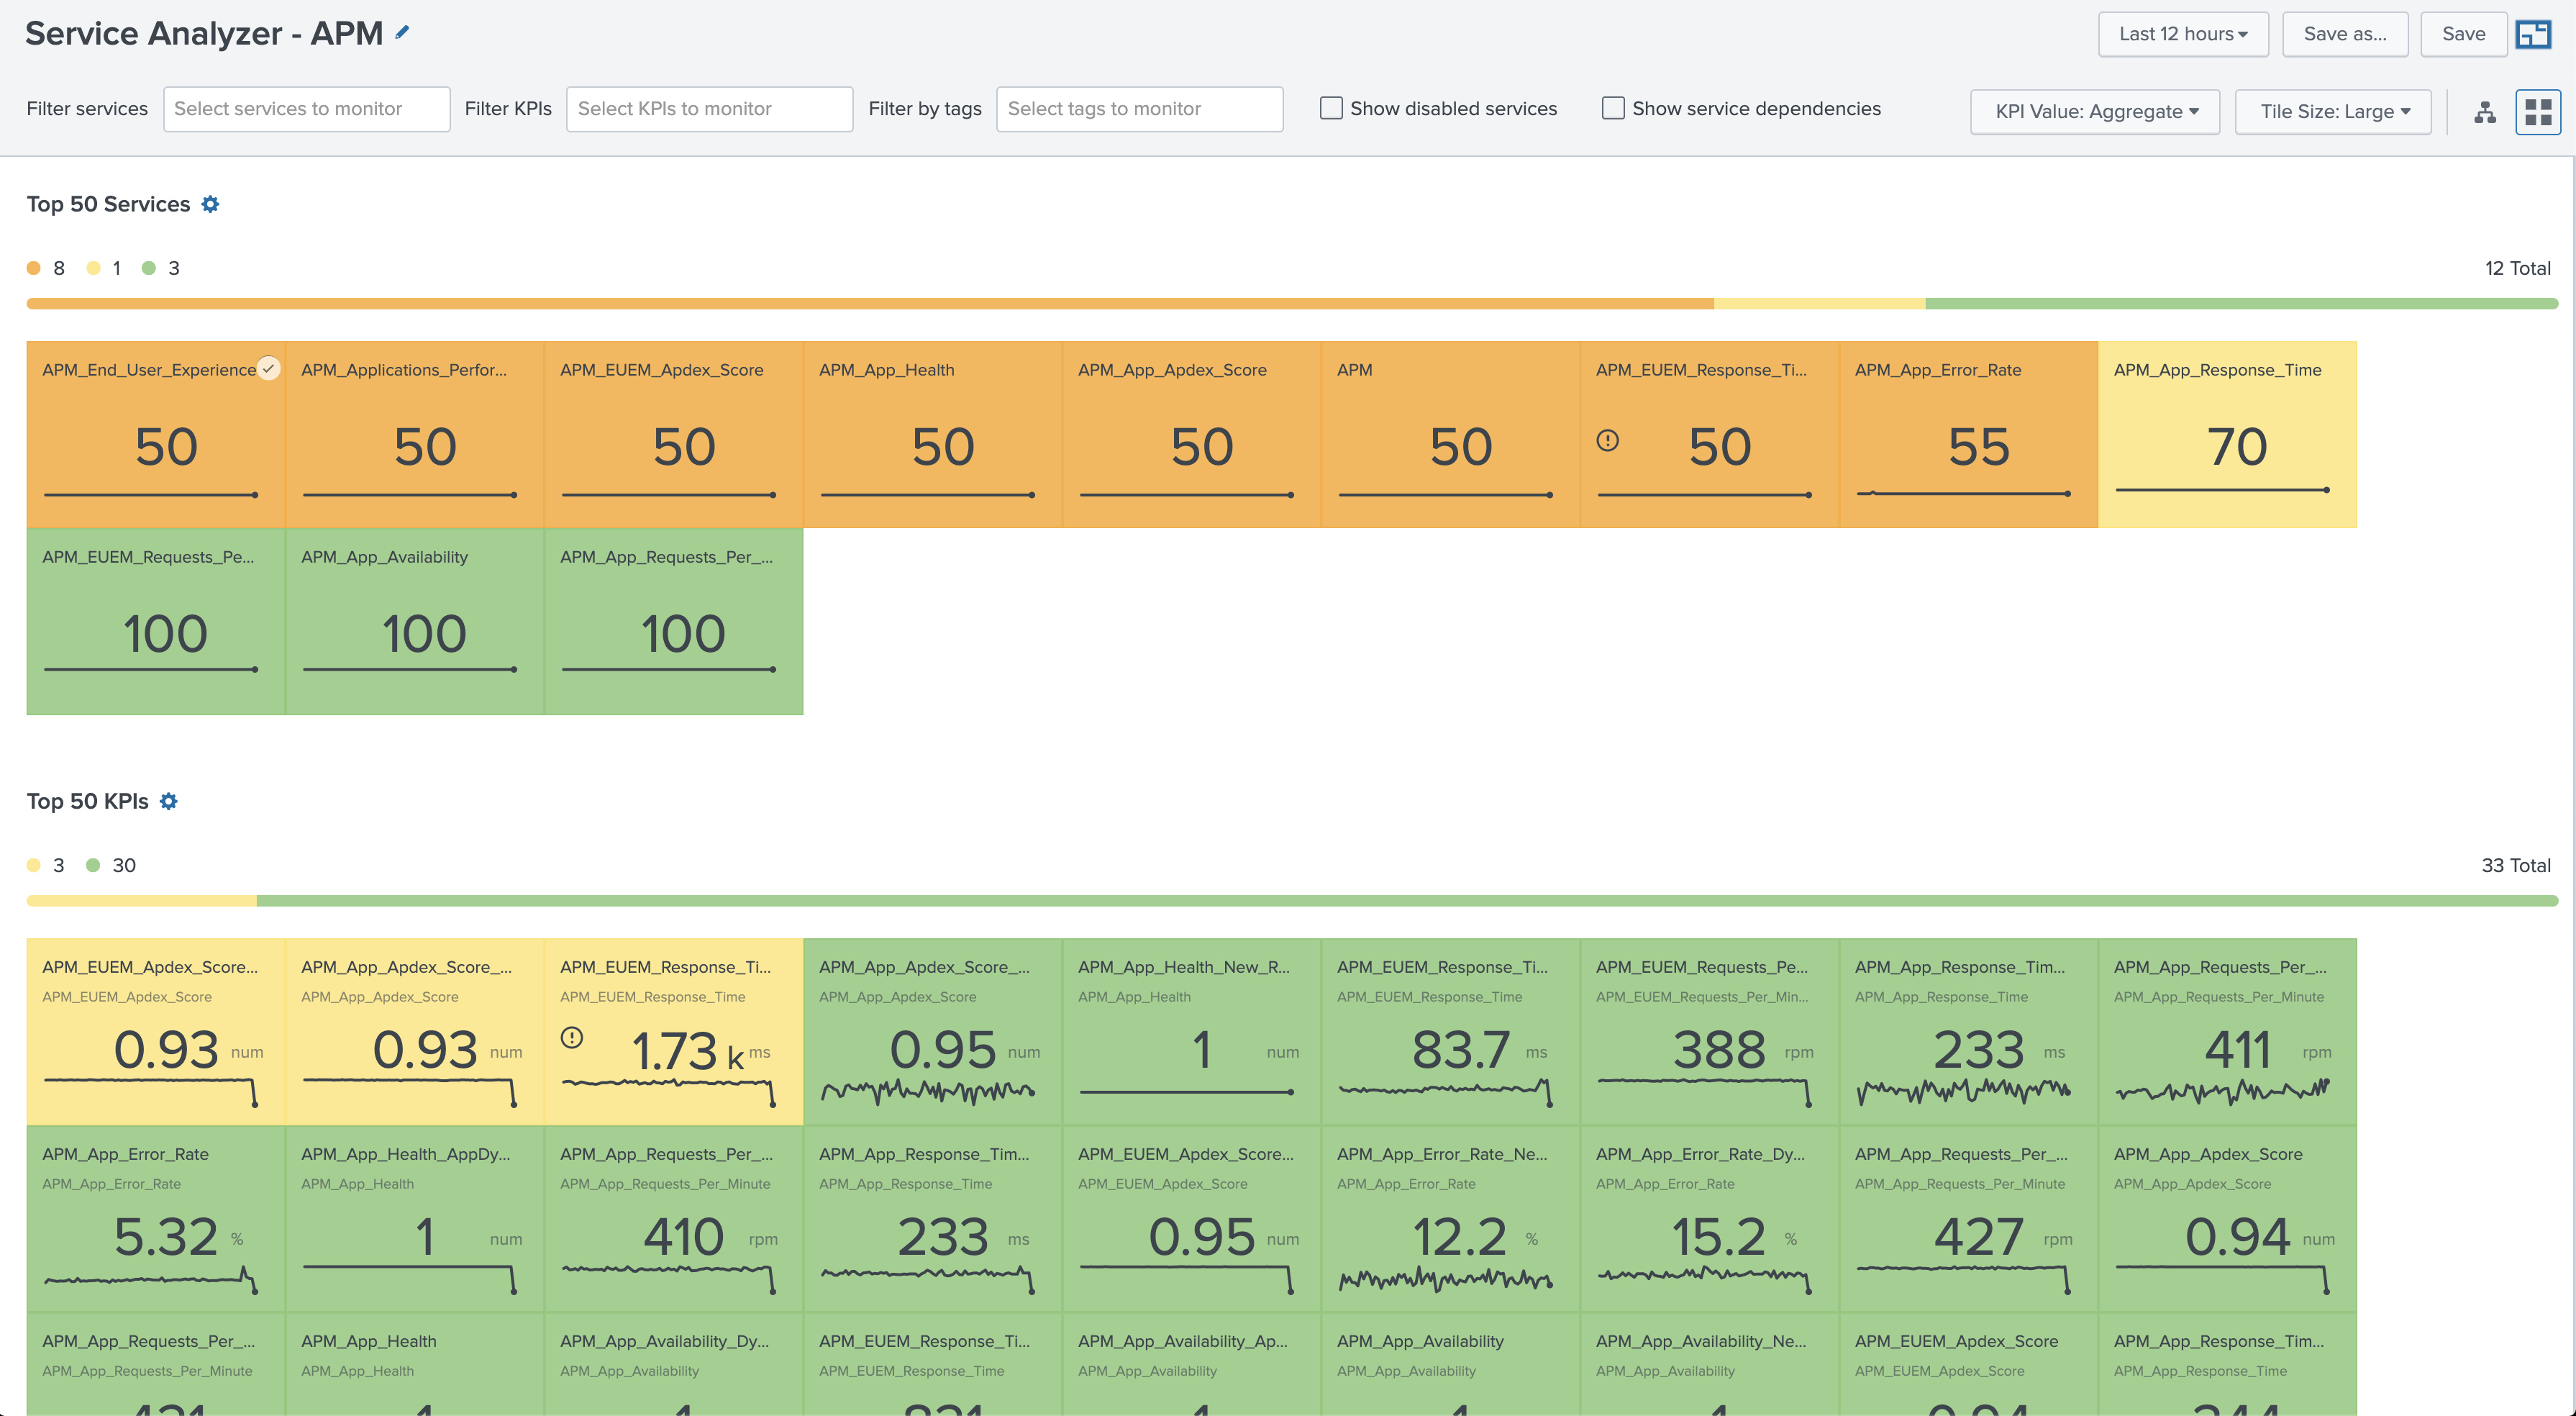
The Service Analyzer - APM provides instant, real-time visibility into the performance of your applications with granular, composite performance metrics across the entire service tree. Detect service anomalies faster with visibility into the performance of each one of the service components that affect the overall performance of your application.
Use the available filters and fields across the top portion of the glass table to curate the results that display.
To access the custom APM Service Analyzer, perform the following steps:
- From the ITSI menu, select Service Analyzer > Analyzers.
- Select Service Analyzer - APM from the list of analyzers.
Monitor your application entities
The content pack includes an APM entity type that groups entities originating from AppDynamics, DynaTrace, and New Relic.
The APM entity type contains a set of vital metrics. Vital metrics are statistical calculations based on SPL searches that represent the overall health of entities of that type.
To view the Entity Health page for the entity type, perform the following steps:
- From the ITSI menu or IT Essentials Work menu, select Infrastructure Overview.
- In the Group by drop-down, choose Entity Type.
- Select the APM entity type to drill down into the vital metrics.
For more information about entity types and vital metrics, see Overview of entity types in ITSI in the Entity Integrations Manual.
Vital metrics
The vital metrics for the APM entity type are as follows:
| Vital metric | Description |
|---|---|
| APM_App_Availability | Average availability time |
| APM_App_Response_Time | Average response time |
| APM_App_Error_Rate | Average error rate |
| APM_App_Error_Requests_Per_Minute | Average throughput |
| APM_App_Apdex | Average Apdex score |
| APM_App_Health | Latest health score |
Entity dashboards
You can select an individual entity on the Entity Health page to drill down further into performance metrics and log events. The Event Data Search dashboard displays the most recent log events associated with an entity over the last hour. The Analytics dashboard lets you view the trend of data coming in from each host by source type in a single snapshot.
To learn more about the available entity dashboards, see the following resources:
- To use the Event Data Search, see Event Data Search dashboard in ITSI.
- To use the Analytics dashboard, see Analyze entity performance metrics in ITSI.
Use APM dashboards
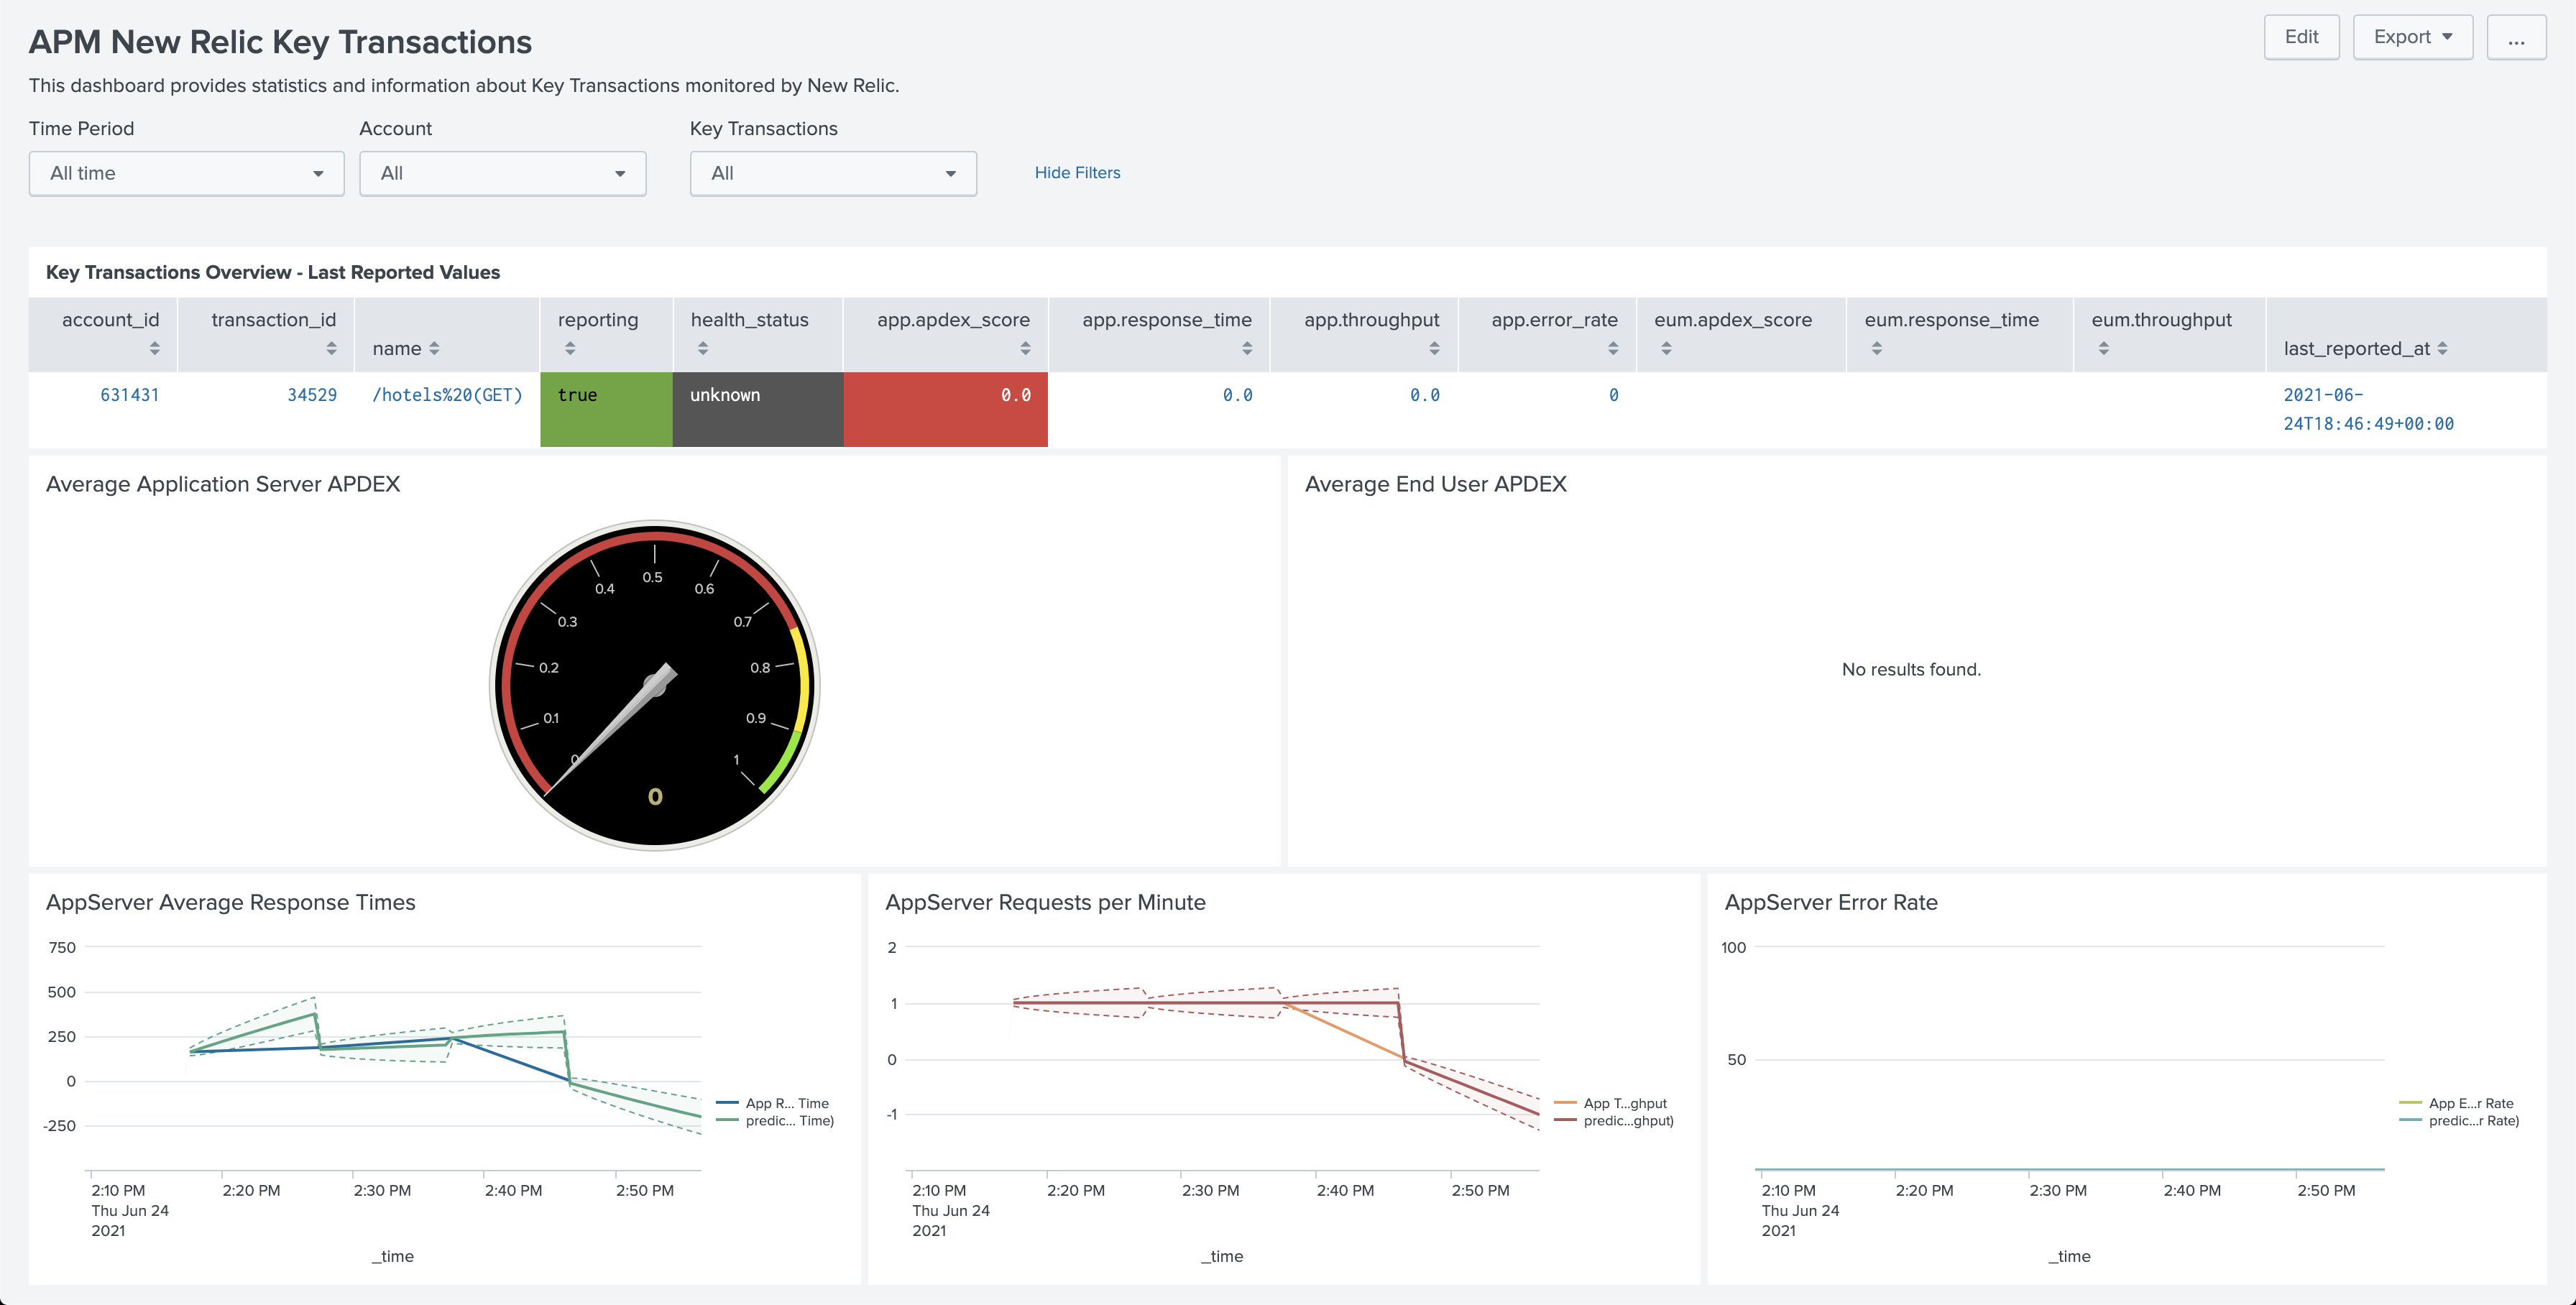
The content pack includes 14 dashboards that were migrated from the vendor-specific apps of Splunk App for AppDynamics, Splunk App DynaTrace, and Splunk App for New Relic so that you can access them in one place.
The following dashboards are available:
| Third-party vendor | Dashboard name |
|---|---|
| AppDynamics | APM AppDynamics Applications APM AppDynamics Incidents |
| Dyna Trace | APM DynaTrace Application Overview APM DynaTrace Application Host Investigator |
| New Relic | APM New Relic Key Transactions APM New Relic Key Mobile Applications |
To view the APM dashboards perform the following steps:
- From the ITSI or the IT Essentials Work menu, select Dashboards > Dashboards.
- Enter "APM" in the filter field to filter the list of dashboards.
- Select a dashboard to view.
- (Optional) From the Edit menu you can edit or clone the dashboard to customize it.
Set up alerts for your applications
Because acceptable metrics vary by application, the APM services don't have alert thresholds set up by default. For steps to set up alert thresholds and generate notable events, see Receive alerts when KPI severity changes in ITSI in the Service Insights Manual.
Once you set up alerts for your KPIs they are aggregated into meaningful episodes on the Episode Review page. To monitor and investigate all episodes for your applications, go to Episode Review. You can drill down into individual episodes to perform more granular root-cause analysis.
For more information about navigating and using Episode Review, see Overview of Episode Review in ITSI in ITSI in the Event Analytics Manual.
| Upgrade to version 1.0.1 of the Content Pack for Third-party APM | Troubleshoot the Content Pack for Third-party APM |
This documentation applies to the following versions of Content Pack for Third-party APM: 1.0.1
 Download manual
Feedback submitted, thanks!