Domain dashboards
| This page is currently a work in progress; expect frequent near-term updates. |
Common dashboard features
The domain dashboards include a number of features that are common to many of the dashboards.
Note: Dashboard filters may not apply to all panels within a dashboard.
Dashboard filters
Many dashboards have a filter bar to restrict the view on the current dashboard to events that match the selected criteria. Selections apply to the current dashboard only; they do not affect other dashboards in Enterprise Security. The following is a typical filter bar.
To use the filter, make your selections and/or enter the desired text, then click the magnifying glass (![]() ) to run the search. For instance, many dashboards support selection of Business Unit or Category, which allows security managers and analysts to compare posture and patterns between different organizational units.
) to run the search. For instance, many dashboards support selection of Business Unit or Category, which allows security managers and analysts to compare posture and patterns between different organizational units.
| Filter | Description |
|---|---|
| Action | Filter based on the status of the action; choices depend on the context: When status is related to the action's source: |
| Business Unit | Filter based on the business unit of the host. Enter the text string to match the business unit. Use the asterisk (*) wildcard to match any number of characters. For example, a* matches america and asia. Match is case-insensitive; all text values must be lowercase.
Note: Business Unit is a free form field implemented using the Splunk for Enterprise Security asset list and identities list. To use this filter, the asset list must be configured for the deployment. See the Enterprise Security Installation and Configuration Manual for more information. |
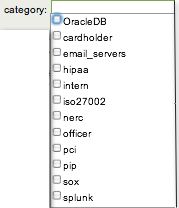
| Category | Filter based on the categories to which the host belongs. It is possible to filter on multiple categories by selecting each category to include.
|
| Time range picker | Filter by time range. Select the time range from the drop-down or click Custom time to specify a start and end time. |
Dashboard drill down
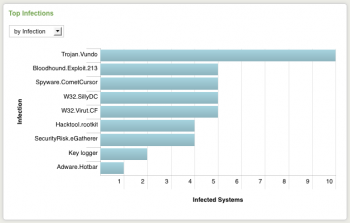
Use the alerts and charts on the Enterprise Security dashboards to drill down into the underlying events by clicking on a point or segment on a chart or a row in a table. Each domain also includes a custom search dashboard to help search for events related to that domain.
Enterprise Security uses the Splunk drill down feature to see the details behind the tables and charts in dashboards.
View full results
The View full results link at the bottom of a panel displays the Search dashboard. Use this to search for the underlying events that are aggregated on the panel.
To use this link:
1. Go to the panel displaying the events of interest.
2. Click View full results at the bottom of the panel.
Drill-down from charts
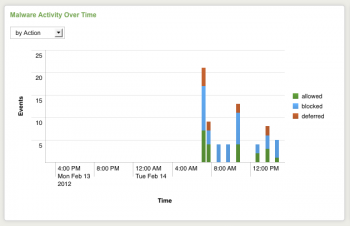
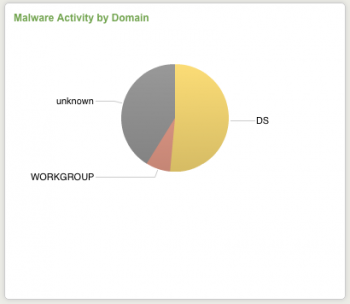
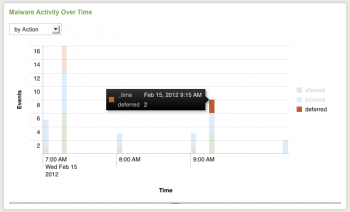
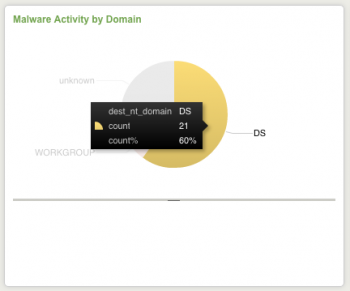
To use data drill-down on charts, click on a segment or point on a chart to view the related events - in this case, events that match the underlying search for the panel and also match the field value clicked. For example, for Malware Activity by Domain, click on a domain in the chart and a search window is displayed with a search for all malware activity in that domain.
To use data drill-down from a chart:
1. Navigate to the chart containing the events.
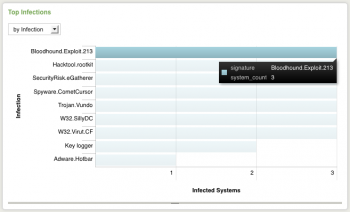
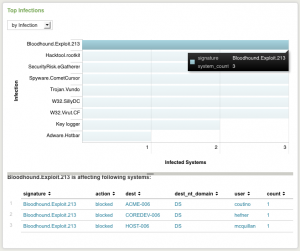
2. Click on a segment, bar, or point on the chart. Drill-down displays a domain-specific search dashboard, the general search dashboard, or shows a second panel underneath the first.
3. In some cases, drill-down displays a second panel underneath the first. In this case, it is possible to drill down further by clicking on a row and/or column as described in the next section.
Drill-down from tables
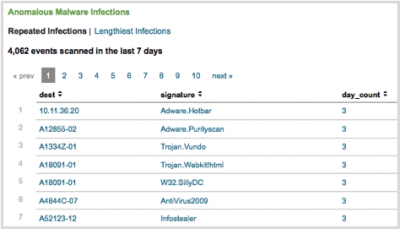
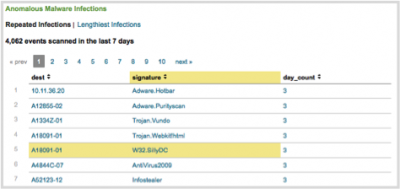
Click on a segment or point on a table to view the related events:
1. Navigate to the table containing the events.
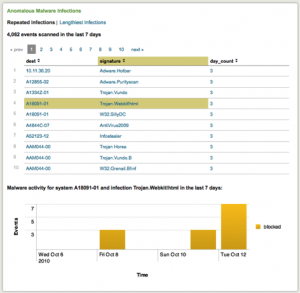
2. Click on a row in the table. Drill-down displays a domain-specific search dashboard, the general search dashboard, or shows a second panel underneath the first.
For some tables, drill-down can select two related items for the search. For example, in the following table, "Account Management Details for User Administrator", clicking administrator at the beginning of the row shows all events where the src_user is administrator. Clicking 2003DOMAIN in a row that begins with administrator shows all events where the src_user is administrator and the dest_nt_domain is 2003DOMAIN.
3. If drill-down displays a second table underneath the first, drill down further by clicking on a row and/or column.
4. In other cases, drill-down displays a chart showing the results for the selection.
| Advanced Threat dashboards | Access dashboards |
This documentation applies to the following versions of Splunk® Enterprise Security: 3.0, 3.0.1


 Download manual
Feedback submitted, thanks!