Network dashboards
The Network Protection domain provides insight into the network and network-based devices, including routers, switches, firewalls, and IDS devices. This domain aggregates all the traffic on the network, including overall volume, specific patterns of traffic, what devices or users are generating traffic, and per-port traffic. It also shows results from the vulnerability scanners on the network.
Traffic Center dashboard
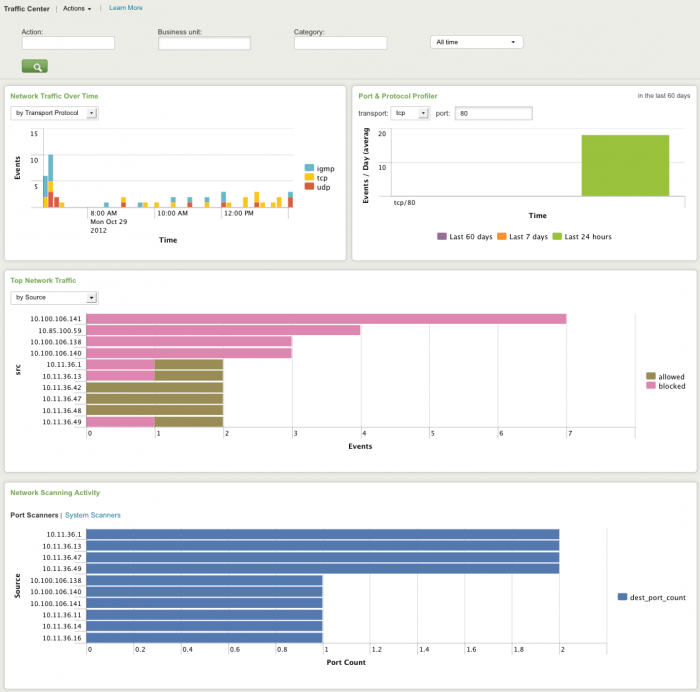
The Traffic Center dashboard profiles overall network traffic, helps detect trends in type and changes in volume of traffic, and helps to isolate the cause (for example, a particular device or source) of those changes. This helps determine when a traffic increase is a security issue and when it is due to an unrelated problem with a server or other device on the network.
Use the filtering options at the top of the screen to limit which items are shown. Configure new data inputs through the Settings menu or search for particular network intrusion events directly through Incident Review.
Clicking chart elements or table rows on this dashboard displays the raw events that are represented. See dashboard drilldown for more information. The following table describes the panels for this dashboard.
| Panel | Description |
|---|---|
| Dashboard filter | Restricts the view on the current dashboard to events that match the selected criteria. Selections apply to the current dashboard only. See descriptions of the standard filter options. |
| Network Traffic Over Time | Shows sudden increases and decreases in the network traffic. Use this panel to identify the specific device(s) or systems that are causing a change in network traffic. For example, viewing traffic by device during an investigation of a sudden decrease in overall network traffic might show that a particular firewall went down. Select an option to see the traffic view split by the selection (by Device, by Transport Protocol, by Source, by Source Port, by Destination, or by Destination Port). |
| Port and Protocol Profiler | Shows the average number of events per day for a specified port and protocol. Use this panel to determine if the number of events for a particular port/protocol is unusually high. To profile a port, enter the port number (0-65535), select the protocol (TCP, UDP, or ICMP) and click the green arrow. The chart will display the average number of events per day for the port over the last day, last 7 days and the last 60 days. |
| Top Network Traffic | Shows the top sources of total traffic volume over the given time frame. Use this information to help pinpoint the cause of traffic problems; for example, viewing traffic by source during an investigation might show that a particular system is consistently producing an excessive amount of traffic. Select an option to see the traffic view split by the selection (by Device, by Transport Protocol, by Source, by Source Port, by Destination, or by Destination Port). |
| Network Scanning Activity | Shows network activity from port scanners or vulnerability (system) scanners and helps identify non-authorized instances of these scanners. Scanners are identified based on activity patterns. Hosts accessing a large number of unique ports on a system are identified as port scanners. Hosts accessing the same port (for example, port 80) on a large number of different systems are identified as system scanners. |
Traffic Search dashboard
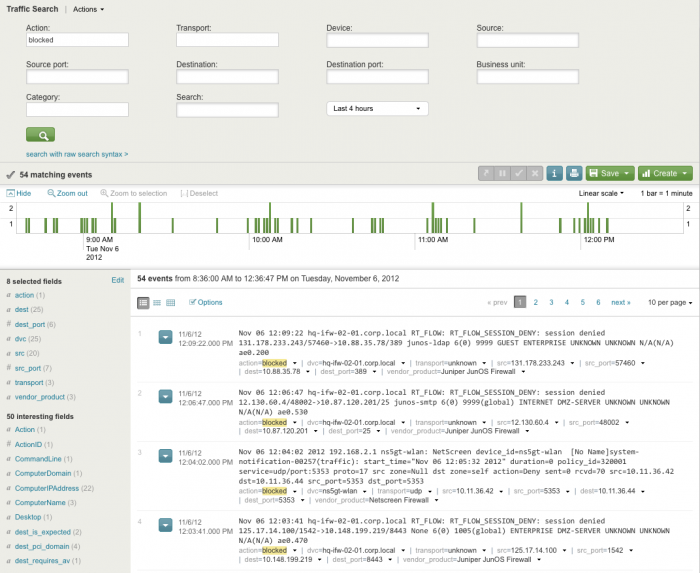
The Traffic Search dashboard displays an overview of all firewall events. From here, when investigating traffic patterns, the log entries for each packet transmitted by the firewalls can be viewed. For example, search for all events from a particular source and find which ports that source has accessed and what services are on those ports.
The Traffic Search selection bar can restrict the view to items that match all of the selected terms. To use this selection bar, select and/or fill in the items to search for, then click the magnifying glass (![]() ) to start the search.
) to start the search.
Note: Use an asterisk (*) when entering a string in an entry box, to represent any number of characters. For example, setting dest to "192.168*" will return all destinations on the 192.168 subnet (192.168.0.0 through 192.168.255.255). Text values in search fields must be lowercase text.
The following filter options are available:
| Filter | Description |
|---|---|
| Action | Filters by the action taken (allowed or blocked). |
| Transport | Filters by the transport protocol used (icmp, tcp, or udp). |
| Device | Limits search to devices (dvc) with matching names. |
| Source | Limits search to source hosts with matching names. |
| Source port | Limits search to source hosts using ports that match the string. |
| Destination | Limits search to destination hosts with matching names. |
| Destination port | Limits search to destination hosts using ports that match the string. |
| Business unit | Limits search to hosts with a matching business unit as defined in the Asset List. |
| Category | Limits search to hosts in the selected categories (from drop-down list) |
| Search | Text field for keyword search (text values must be lowercase test) |
| time range | Limits search to specified time range |
Intrusion Center dashboard
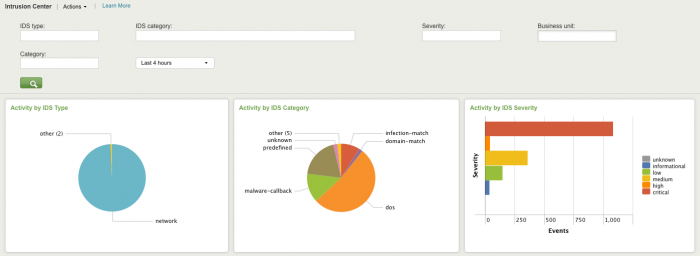
The Intrusion Center provides an overview of all network intrusion events from the Intrusion Detection Systems (IDS) and Intrusion Prevention Systems (IPS) on the network that are providing data into Splunk. IDSs give a deeper view into the traffic on the network, based on the detailed information contained in their log events. This dashboard helps monitor IDS activity and see trends in severity and changes in volume of IDS event. Depending on the rules for the organization, a security analyst should monitor this dashboard on a regular basis (such as hourly). This dashboard can also be used to gain additional detail during an investigation.
Use the filtering options at the top of the screen to limit which items are shown. Configure new data inputs through the Settings menu or search for particular network intrusion events directly through Incident Review.
Clicking on chart elements or table rows on this dashboard will display the raw events that are represented. See dashboard drilldown for more information.
The following table describes the panels for this dashboard.
| Panel | Description |
|---|---|
| Dashboard filter | Restricts the view on the current dashboard to events that match the selected criteria. Selections apply to the current dashboard only. See descriptions of the standard filter options. The following domain-specific options are available:
|
| IDS Activity by IDS Type | Shows the distribution of IDS events by type of Intrusion Detection System (Any, application, host, network, or wireless). |
| IDS Activity by Category | Shows the attacks occurring on the network aggregated by IDS category. |
| IDS Activity by Severity | Shows the attacks occurring on the network aggregated by IDS severity level. Viewing attacks by severity allows a drill down to get a sense of which issues are important. |
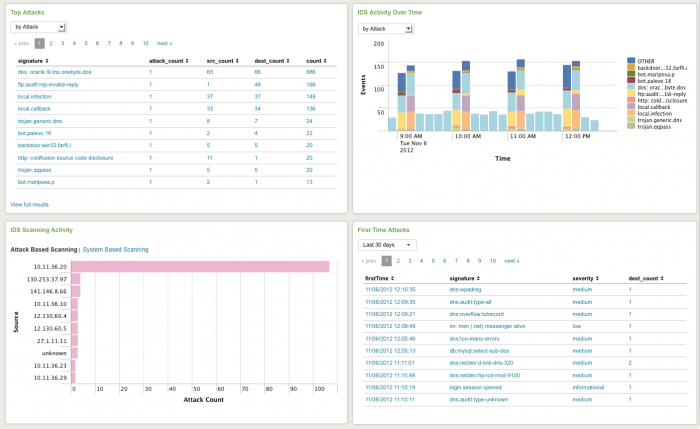
| Top Attacks | Shows the top attacks by how often they have occurred. Looking at the number of issues by occurrence helps determines which ones are likely false positives and background noise versus the ones that need further investigation.
|
| IDS Activity Over Time | Shows volume of IDS activity. Use this panel to see sudden increases in IDS activity and identify the specific device(s) or systems that are causing a change. |
| IDS Scanning Activity | Shows systems displaying two well-known patterns of attack, which helps filter out false positives and focus on consistent patterns of attack.
|
| First Time Attacks | Shows attacks that have been identified for the first time. New attack vectors indicate that a change has occurred on the network, potentially due to the presence of a new threat (for example, a new virus). Additionally, this panel can help recognize events that are false positives. Events that have been occurring for a few years are more likely to be false positives than an event that has only recently been observed, although in some cases the "new" event is a false positive due to a new IDS signature. |
Intrusion Search dashboard
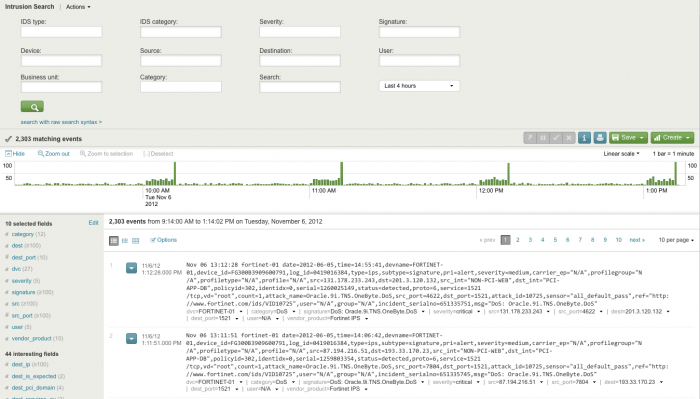
The Intrusion Search dashboard helps search IDS-related events such as attacks or reconnaissance-related activity.
The Intrusion Search selection bar can restrict the view to items that match all of the selected terms. To use this selection bar, select and/or fill in the items to search for, then click the magnifying class (![]() ) to start the search.
) to start the search.
Note: Use an asterisk (*) when entering a string in an entry box, to represent any number of characters. For example, *sql* matches sql_slammer_worm and sql_injection_attack.
The following filter options are available:
| Filter | Description |
|---|---|
| IDS type | Drop-down list of IDS types |
| IDS category | Filters by the vendor-defined category in the event. |
| Severity | Filters by the selected severities (critical, high, medium, low, or informational). |
| Signature | Limits search to events with signatures that match the entered string. |
| Device | Limits search to devices with names that match the entered string. |
| Source | Limits search to sources with names that match the entered string. |
| Destination | Limits search to destinations with names that match the entered string. |
| User | Limits search to events with user names that match the entered string. |
| Business unit | Limits search to hosts with a matching business unit as defined in the Asset List. |
| Category | Limits search to hosts in the selected categories |
| Search | Text field to enter search keywords |
| time picker | Choose time range to search over |
Note: Text values in search fields must be lowercase text.
Vulnerability Center dashboard
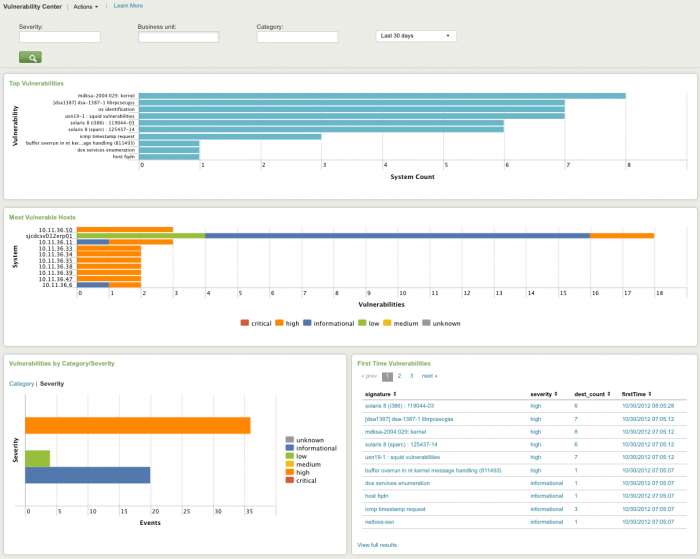
The Vulnerability Center provides an overview of the events detected by vulnerability scanners. Vulnerability scanners proactively identify issues that may be used to gain unauthorized access to the IT systems. Therefore, the Vulnerability Center dashboards are most likely to be used by administrators that are seeking to identify and resolve vulnerabilities on systems they manage. However, the Vulnerability Center may also be used by incident response personnel seeking to identify all hosts that are vulnerable to a new threat on the network (for example, to determine all hosts that may be impacted by a potential outbreak that is developing on the network).
The following table describes the panels for this dashboard. Drilldown is available for graphs and tables. See dashboard drilldown for more information.
| Panel | Description |
|---|---|
| Dashboard filters | Restricts the view on the current dashboard to events that match the selected criteria. Selections apply to the current dashboard only. See descriptions of the standard filter options. |
| Top Vulnerabilities | Shows the most common issues reported by the vulnerability scanners. The reported issues are aggregated by host so that the chart represents the number of unique occurrences of the issue as opposed to the number of times the issue was detected (since scanning a single host multiple times will likely reveal the same vulnerabilities each time). |
| Most Vulnerable Hosts | Shows the hosts with the highest number of issues. |
| Vulnerabilities by Category/Severity | Shows issues by the category or severity assigned by the vulnerability scanner. Helps identify trends that are not visible when looking at vulnerabilities individually. |
| Vulnerabilities by Length | Shows the vulnerabilities that have existed the longest. These vulnerabilities are likely to be a more significant issue than newer vulnerabilities, because older vulnerabilities are not being resolved and may continue to exist until they are escalated. |
| Delinquent Scanning | Shows vulnerability scanners that do not appear to be scanning anymore, specifically devices that have reported vulnerabilities in the past, but have recently stopped reporting vulnerabilities. Helps identify scanners that are no longer functioning correctly, for example, due to a hardware problem, misconfiguration, etc. |
| First Time Vulnerabilities | Shows the most recent new vulnerabilities detected as well as the date each one was first observed. Helps identify new issues appearing on the network that need to be investigated as potential new attack vectors. |
Vulnerability Operations dashboard
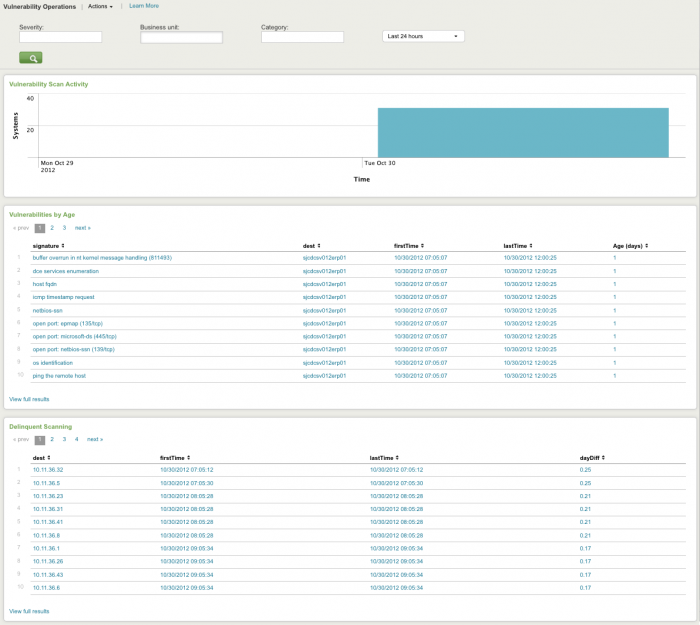
The Vulnerability Operations dashboard tracks the status and activity of the vulnerability detection products deployed in your environment. Use this dashboard to see the overall health of your scanning systems, to identify long-term issues, and also see systems that are no longer being scanned for vulnerabilities.
Use the filtering options at the top of the screen to limit which events are shown. Search vulnerability events directly through Vulnerability Profiler. Hover over chart items for more detail. Click on chart elements or table rows to display the raw events that are represented.
The following table describes the panels for this dashboard. Drilldown is available for charts and tables. See "Drill-down from charts" in this manual for more information.
| Panel | Description |
|---|---|
| Dashboard filters | Restricts the view on the current dashboard to events that match the selected criteria. Selections apply to the current dashboard only. See descriptions of the standard filter options. |
| Vulnerability Scan Activity | Displays vulnerability scan activity by systems over time. Hover over item for details. |
| Vulnerability by Age | Displays detected vulnerabilities by age, with signature, destination, and event time. Click an item to view in the Vulnerability Profiler for more detail. |
| Delinquent Scanning | Displays vulnerability scans with a severity of "high". Includes signature. |
Click "View full results" to see the raw search and more event details for that panel.
Vulnerability Profiler dashboard
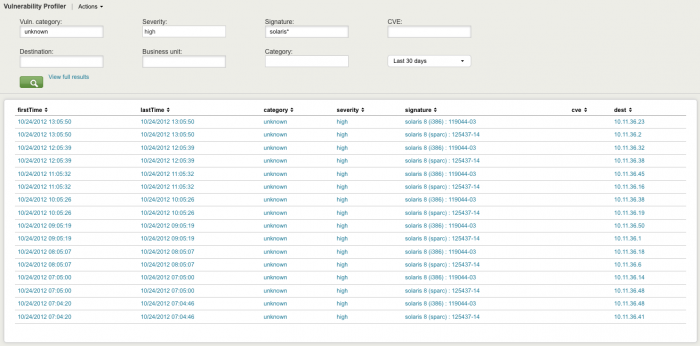
The Vulnerability Profiler shows a list of all vulnerability-related events. Use the fields to filter results and narrow your search.
| Panel | Description |
|---|---|
| Vuln. category | Vendor provided categorization string |
| Severity | Drop-down list of severity options |
| Signature | Vendor-provided description string |
| CVE | Common Vulnerability Enumeration value is an industry standard identifier used for vulnerability correlation, see http://cve.mitre.org/ for more information |
| Destination | Asset with the observed vulnerability |
| Business unit | Business unit of that asset |
| Category | Category of that asset |
| time picker |
Note: Text values in search fields must be lowercase text.
| Endpoint dashboards | More Network dashboards |
This documentation applies to the following versions of Splunk® Enterprise Security: 3.0, 3.0.1
 Download manual
Feedback submitted, thanks!