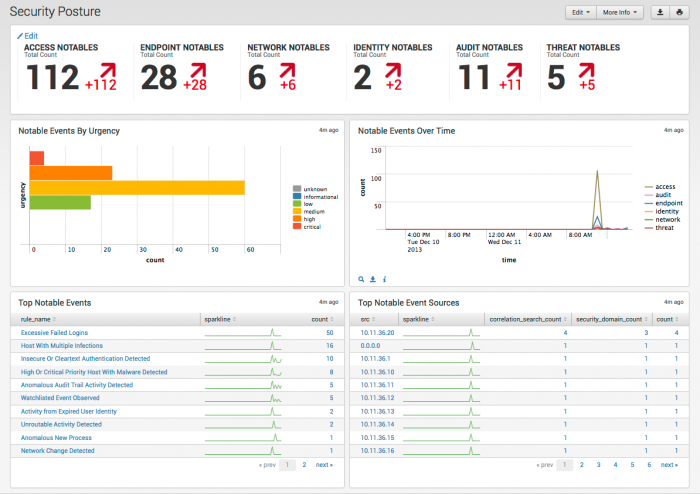
Security Posture dashboard
The Security Posture dashboard is the home screen for the Splunk App for Enterprise Security, designed to provide high-level insight into the notable events across all domains in your deployment, suitable for display in a Security Operations Center (SOC). This dashboard shows all events from the past 24 hours, along with the trends over the past 24 hours, and auto-updates in real time providing real-time information on events.
Key indicators
Key indicators at the top of the dashboard display selected notable events for your deployment over the past 24 hours. The current total count of events, the trend of events, and the total increase or decrease in numbers are shown.
Dashboard panels
The following table describes the panels for this dashboard. Drill-down is available for graphs and tables. See "dashboard drill-down" for more information.
| Panel | Description |
|---|---|
| Notable Events by Security Domain | Displays the total number of notable events for each domain and supporting applications. The key indicators provide an overview of the notable events for that domain. Configure severity levels by going to Configure > App Settings > Configure Rangemaps. See the Installation and Configuration Manual for more information. |
| Notable Events by Urgency | Gives a holistic view of notable events.
Identity priorities can also be monitored through this dashboard. |
| Notable Events by Time | Gives a holistic view of notable events.
|
| Notable Events by Count | Events organized by number of events (most to least) |
| Top Notable Events by Source / Destination | Events organized by source / destination (most to least) |
| Enterprise Security Home | Incident Review dashboard |
This documentation applies to the following versions of Splunk® Enterprise Security: 3.0, 3.0.1

 Download manual
Feedback submitted, thanks!