Incident Review dashboard
Use the Incident Review dashboard to review all notable events across the deployment, review specific incidents and set event status, and assign events to analysts for review.
Review this dashboard on a regular basis to identify and investigate issues. Enterprise Security shows all incident review activity on the Incident Review Audit dashboard. Select Audit > Incident Review Audit to see current activity.
Note: All text values in dashboard filter fields must use lowercase text.
When the Incident Review dashboard is being used to manage notable events, all updates will restart searches. Real-time searches driven by the Incident Review dashboard will be automatically stopped if not touched for 90 seconds.-
If using a real-time search, the search must be finalized before interacting with notable events in the dashboard. To doc this click Finalize (![]() ).
).
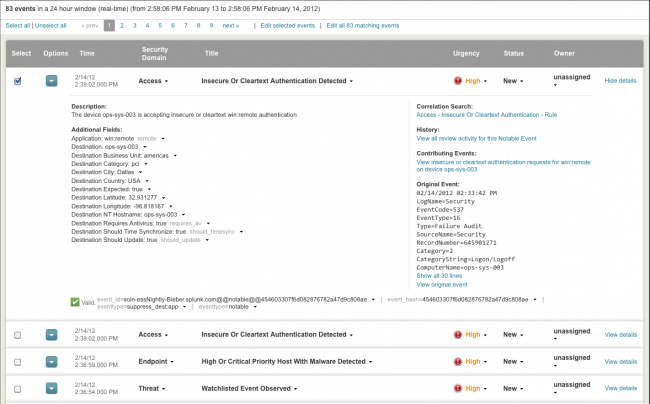
The following screen shows the details of a notable event on the Incident Review or Security Posture dashboard:
Drill-down
A notable event may be associated with one or many raw events. The drill-down search feature allows an analyst to follow this association, into a search for the related raw events.
The following table describes the fields that appear in every notable event.
| Field | Description |
|---|---|
| Select | Click this box to select or deselect the events to review. Use Select All or Unselect All to select or deselect all events visible on the page. Note:The Incident Review dashboard can display incoming events in real time, but the search must be finalized before these events can be managed. This will deselect any selected notable events. To work with events, wait for the search to finish running or click Finalize to stop the search. |
| Options | Build Eventtype, Create notable event, Extract Fields, Show Source, Suppress event from this source |
| Time | The time at which Enterprise Security detected the notable event. The timestamps of the original underlying events will be different from this. |
| Security Domain | The security domain of the event. Use this information to determine which other dashboards to view when investigating the event. For example, if several instances of a malware signature appear in the Incident Review, go to the Endpoint Protection domain to see the current malware behavior in the environment. |
| Title | The name of the correlation search that produced the notable event.
Note: Users with sufficient permissions can click on this field to edit the search. See the Installation and Configuration Manual for more information about editing correlation searches. |
| Urgency | Urgency is calculated based on the severity of the event (determined from the raw data) and the priority of the asset or identity on which the event occurred. Note: Configure asset or identity priorities using the Enterprise Security asset list and identity list. See the Enterprise Security Installation and Configuration Manual for more information. |
| Status | The review status (unreviewed, reviewed, closed) of the event. You can change the status of a notable event in the Incident Review or Security Posture dashboard. Note: Users with sufficient permissions can extend or modify the review status options by navigating to Configure > Edit Notable Event Statuses. |
| Owner | The current owner of the event |
| View details | A description of the event. |
| Drilldown link | A link showing related raw events. Includes all related events, not just those that triggered this event. |
| Event ID | A unique identifier for the notable event. |
| Event hash | A digital signature that is used to determine if the notable event was tampered with.
Note: The text next to the notable event will indicate if the event has been tampered. |
| Event-specific fields | A notable event may also include other fields specific to the type of event. For example, a notable event for a specific infection on a high number of hosts includes a signature field that identifies the infection. Other common fields include host, source, destination, user, and location. Click on any field with a down arrow to the right to restrict the view to notable events with that value. |
Using the Incident Review dashboard
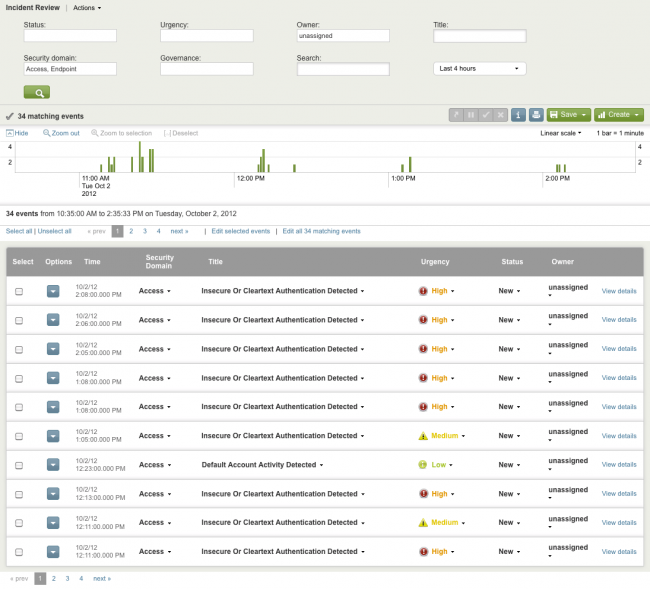
Filter notable events using the search bar to restrict the view to notable events that match all of the selected terms, or by clicking on a field.
To filter using the search bar:
1. Select and/or fill in the items to filter on.
When entering a string in an entry box, use an asterisk (*) as a wildcard to represent any number of characters. For example, entering trojan* finds trojan horse and trojan.vundo. Text values entered into fields must be lower case.
2. Click the magnifying glass (![]() ) to perform the search. The view is restricted to events that match all of the selected filters.
) to perform the search. The view is restricted to events that match all of the selected filters.
The following table shows the available filters:
| Filter | What it does |
|---|---|
| Status | Filter by the workflow statuses of the notable events (select from drop-down) |
| Urgency | Filter by the workflow urgency of the notable events (select from drop-down) |
| Owner | Filter by the workflow owner of the notable events (select from drop-down) |
| Title | Filter by the title of the notable event (free-form entry) |
| Security Domain | Filter by the security domain of the notable events (select from drop-down) |
| Governance | Filter by the governance impact of the notable events (select from drop-down) |
| Search | Filter with direct splunk search language queries (free-form entry) |
| Time Range | Select the applicable time range |
Edit notable events
Notable events cannot be edited until the search is finalized. Some searches may take more time to finalize than others. Real-time window searches will never finalize by themselves. Click Finalize (![]() ) to finalize the real-time search and edit notable events.
) to finalize the real-time search and edit notable events.
Below the time line, the following controls can be found:
| Control | What it does |
|---|---|
| Select All | Selects all visible notable events for editing |
| Unselect All | Clears selection of notable events |
| Pagination controls | Browse through matching notable events |
| Edit selected events | Edit workflow status, ownership, urgency, and comment of the notable events that have been selected via checkbox controls or "select all" |
| Edit all XX matching events | Edit workflow status, ownership, urgency, and comment of all notable events that match the current set of filters. "XX" identifies the actual number of matching events. |
How to edit events in the Incident Review dashboard
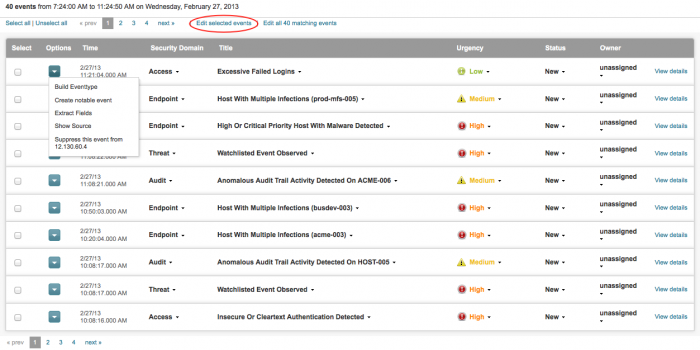
From the Incident Review dashboard, select an event by clicking the check box to the left and click View details. The notable event expands. Click the small triangle for additional options (for example, Build Eventtype, Create notable event, Extract Fields, Show Source, or Suppress events to...). Using this event's source data, you can create a notable event or suppress events with these options. Click the event title to drill down to the raw data for that event.
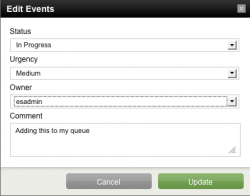
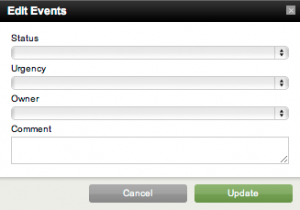
To edit an event, check the box next to it and click Edit selected events to open the Edit Event panel. Change the status of the event, assign it to an Enterprise Security Admin (esadmin), and add a comment.
- Using the drop-down menu in the Edit Event panel, set the Status of the notable event to In Progress.
- Set the Urgency to Medium.
- Select esadmin as the Owner.
- Enter a review comment ("Adding this to my queue").
- Click Update.
Note: Comments can be made mandatory and the Urgency override can be disabled. See Configure > Log Review Settings to modify these settings. By default the comment required setting is turned off.
The sample changes are updated in the list of notable events.
Change event status
To change status and annotate the notable events on the Incident Review dashboard:
1. Open the Incident Review dashboard from the menu in Enterprise Security.
2. Select incidents to edit, by changing status and/or adding annotations. To do this, click the box next to the notable event, or click Select all to select all events on the page. Multiple events can be selected and given the same status and comment.
Note: As long as the notable event searches are running, Splunk periodically refreshes the page to update the display. This will deselect any selected notable events. To work with notable events, wait for the search to finish running or click Finalize to stop the search.
3. Click Edit Status at the top of the Notable Events panel. The Edit Events status window opens.
Note: The Incident Review dashboard allows searching for specific values that cannot be set through editing of notable events. Specifically, you can search for notable events with Status=Unassigned, Urgency=Unknown, Owner=Unassigned, or Domain=Unknown. These values may not be selected when editing a notable event.
4. To change the status, select the desired status from the drop-down menu.
5. Include notes that describe your observations about the event. Include additional notes every time you edit the status of an incident; each description is saved. This allows you to build an audit history of each incident. You can view the audit history using the Incident Review Audit dashboard.
6. Click Update.
Mandatory comments
Comments can be made mandatory in the "Edit Events" panel by changing the configuration in Configure > Log Review Settings. By default the comment required setting is turned off. When this feature is turned on, a length for the comment must be specified.
See "Log Review Settings" in the Enterprise Security Installation and Configuration Manual for more details.
Filter notable events
Filter notable events using the sidebar to restrict the view to notable events that match all of the selected terms, or by clicking on a field.
To filter using the sidebar:
1. Select and/or fill in the items to filter on.
When entering a string in an entry box, use an asterisk (*) as a wildcard to represent any number of characters. For example, entering Trojan* finds Trojan Horse and Trojan.Vundo. Search is case-insensitive.
2. Click the magnifying glass (![]() ) to perform the search. The view is restricted to events that match all of the selected filters.
) to perform the search. The view is restricted to events that match all of the selected filters.
The following table shows the available filters:
| Filter | Description | Values |
|---|---|---|
| Status | Filters notable events by status | unreviewed, reviewed, or closed |
| Urgency | Filters notable events by urgency | informational, low, medium, high, or critical |
| Name | Filters by notable event name. | Arbitrary string; can use * to represent any number of characters. |
| Security Domain | Filters notable events by Enterprise Security domain | Access, Endpoint, Network, Threat Intelligence, Identity, Audit & Data Protection |
| Governance | Filters notable events by governance standards | Default supports PCI. Governance is set as part of the correlation search. See the Installation and Configuration Manual for more information. |
| Text Search | Searches for a string anywhere in the event; use the * wildcard as necessary. |
To filter using a field:
1. Click on the text of any field that has a down arrow (![]() ) to the right.
) to the right.
2. The view is restricted to notable events that match the value in that field. If other filters are active, the view is restricted to events that match all of the filters.
| Security Posture dashboard | Predictive Analytics dashboard |
This documentation applies to the following versions of Splunk® Enterprise Security: 3.0, 3.0.1


 Download manual
Feedback submitted, thanks!