Endpoint dashboards
The Endpoint Protection domain provides insight into malware events including viruses, worms, spyware, attack tools, adware and PUPs (Potentially Unwanted Programs), as well as endpoint protection deployment.
Malware Center dashboard
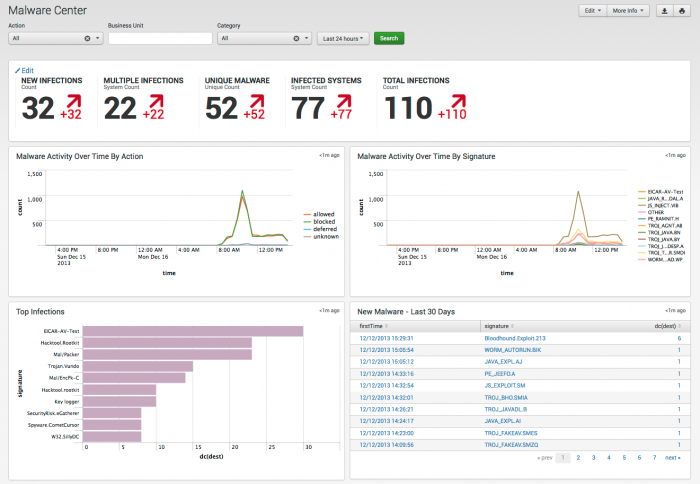
The Malware Center provides an overall picture of malware (such as viruses, spyware, or Trojans) in the enterprise environment and how this picture is changing over time based on data gathered by Splunk. Focusing on the most common malware events, and the hosts and domains with the most infections, this dashboard is useful for identifying possible outbreaks.
Use the filtering options at the top of the screen to limit which events are shown. Configure new data inputs through Splunk Settings, or search malware events directly through Malware Search.
Clicking chart elements or table rows on this dashboard displays the raw events that are represented. See dashboard drilldown for more information. The following table describes the panels for this dashboard.
| Panel | Description |
|---|---|
| Dashboard filter | Restricts the view on the current dashboard to events that match the selected criteria. Selections apply to the current dashboard only. See standard filter options for more information. |
| Malware Activity Over Time | Shows all detected malware over the specified time period. Choose to see the view categorized by the action taken or by infection name. Use this chart to detect spikes in overall malware activity or to track a particular infection. |
| Top Infections | Shows a bar chart of the top infections. This panel helps identify outbreaks related to a specific type of malware or on a specific system. |
| First Time Infections | Shows malware that was detected on the network for the first time. For each type of malware, it also shows the total number of infections detected. First-time infections are the most likely to cause outbreaks. |
| Key Malware Statistics | Shows an alert for all infections, systems, and domains with a "severe" infection level. These indicate a possible outbreak on the network. The panel consists of three statistics:
Note: Configure the values that trigger an alert by going to Configure > App Settings. See the Installation and Configuration Manual for more information. |
| Malware Activity by Domain | Shows the total malware activity in the environment categorized by domain. An outbreak is often initially confined to a particular domain, particularly when domains are defined regionally. |
| Recent Malware | Shows the details of all malware-related events in the past 60 minutes. |
Note: There's a known issue with color mapping in the Malware Center view where "allowed" is indicated in green and not red, even though it is often indicating a "bad" thing such as EPP failure.
Malware Search dashboard
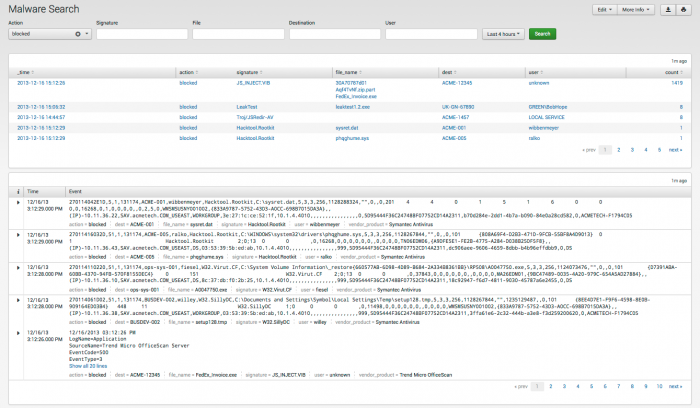
The Malware Search dashboard helps search for malware-related events, based on specified criteria.
The Malware Search selection bar restricts the view to items that match all of the selected terms. To use this selection bar, select and/or fill in the items to search for, then click Search to start the search.
Note: Enter a string in an entry box using an asterisk (*) to represent any number of characters. For example, entering trojan* finds trojan horse and trojan.vundo. Text values in search fields must be lowercase text.
The following filter options are available:
| Filter | Description |
|---|---|
| Action | Filters search by action (allowed, deferred, blocked) |
| Signature | Limits search to malware with matching signatures. |
| Destination | Limits search to destination hosts with matching names. |
| Dest. NT domain | Limits search to NT or Active Directory domains with matching names |
| User | Limits search to usernames that match. |
| File name | Limits search to infected files with matching names |
| File path | Limits search to infected files that with matching paths. For example, use this to search for an infection that uses the name of a known executable, but that is stored in a different location, such as C:\Windows\System32.
|
| File hash | Limits search to infections with a matching file hash. |
| Business unit | Limits search to specific business unit |
| Category | Limits search to category selected from drop-down menu |
| Search | Free form search field - text values must be lowercase text |
| time range | Limits time range to range selected from drop-down list |
Malware Operations dashboard
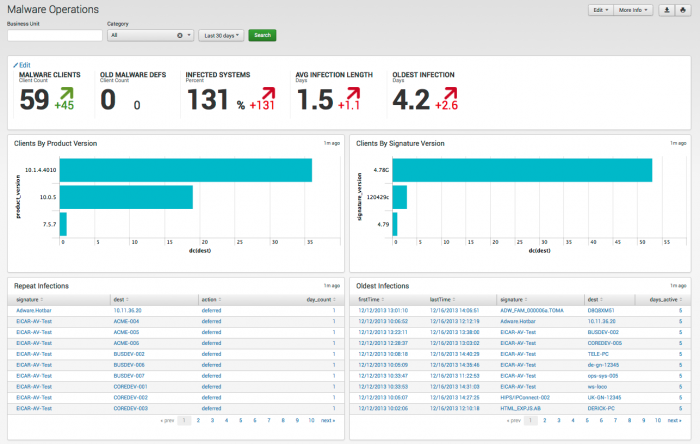
The Malware Operations dashboard tracks the status of the endpoint protection products that have been deployed. Use this dashboard to see the overall health of systems and to identify systems that need updates or modifications to their endpoint protection software. This dashboard can also be used to see how the endpoint protection infrastructure is being administered.
Use the filtering options at the top of the screen to limit which events are shown. Clicking on chart elements or table rows in this dashboard displays the raw events that are represented. See dashboard drilldown for more information. The following table describes the panels for this dashboard.
| Panel | Description |
|---|---|
| Dashboard filter | Restricts the view on the current dashboard to events that match the selected criteria. Selections apply to the current dashboard only. See descriptions of the standard filter options. |
| Average Infection Length by Time | Shows the mean time that systems have remained infected. This view identifies whether the enterprise is responding quickly to infections, or if it is falling behind. |
| Anomalous Malware Infections | Shows repeated or lengthy infections. Typically this indicates complex infections where first-level remediation is not enough to eliminate the root cause. For example, this occurs when an undetected worm or other malware is downloading a second detectable piece of malware. Virus detection and cleaning will remove the second piece of malware, but the primary cause of infection remains untouched. |
| Malware Client Distribution | Shows the versions of malware clients across the deployment and helps determine which signature files need to be updated. |
| Malware Signature Update Tracking | Shows the signatures of the malware clients across the deployment and helps determine which clients need to be updated. |
| Endpoint Application Errors | Shows problems with endpoint clients, which may also indicate systems that are not being scanned. For example, this shows panel systems where endpoint protection cannot perform a search because the system is running out of disk space. |
System Center dashboard
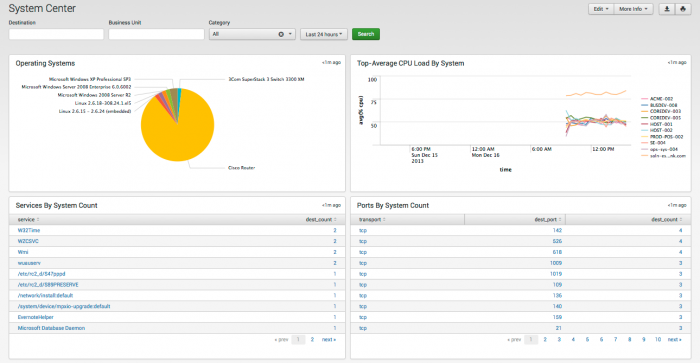
The System Center dashboard shows information related to endpoints beyond the information reported by deployed anti-virus or host-based IDS systems.
The System Center provides reporting of endpoint statistics and information that have been gathered by Splunk. System configuration and performance metrics for hosts, such as memory usage, CPU usage, or disk usage can be displayed on this dashboard.
Use the filtering options at the top of the screen to limit which items are shown. Configure new data inputs through the Settings menu, or search for particular systems-related events directly through Incident Review.
Clicking on chart elements or table rows on this dashboard displays the raw events that are represented. See dashboard drilldown for more information. The following table describes the panels for this dashboard.
| Panel | Description |
|---|---|
| Dashboard filter | Restricts the view on the current dashboard to events that match the selected criteria. Selections apply to the current dashboard only. See descriptions of the standard filter options. |
| Operating Systems | Shows the operating systems deployed on the network. Use this to detect operating systems that should not be deployed in the environment. |
| Resource Utilization | Shows resource utilization for the hosts on the network. Select CPU, memory, or disk to see the utilization for that resource. |
| System Uptime | Shows systems that have not been rebooted in the specified period. Hosts with lengthy uptime may need to be rebooted in order to ensure that security patches are applied. |
| System Configurations | Shows the status of two critical security configurations:
|
| Process/Services | Shows the most common processes across the environment. Spikes can indicate the presence of malware or a system with health problems:
|
| Ports/Users | This panel shows four different views, depending on the selected tab and drop-down:
|
Note: If incorrect or missing data is showing up in the Search Center dashboard, be sure that the technology add-ons for the specific data being used are installed on the full forwarders in the deployment. Technology add-ons containing knowledge needed for parsing of data need to be installed on the full forwarders.
Time Center dashboard
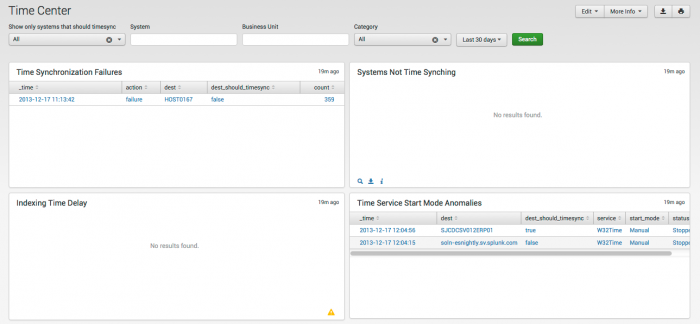
The Time Center dashboard helps ensure the integrity of data by identifying hosts that are not correctly synchronizing their clocks. There are rules that will fire and create an alert when a system's time is discovered to be out of sync. When such an alert is received, drill down by clicking on any of the chart elements or table rows on this dashboard to go directly to the raw data and investigate further.
Note: What is a should_timesync system?
"should_timesync" systems are denoted by a value of should_timesync=true in the Asset table. The main search controls above contain a filtering option that will include/exclude these systems.
Clicking on chart elements or table rows in this dashboard displays the raw events that are represented. See dashboard drilldown for more information. The following table describes the panels for this dashboard.
| Panel | Description |
|---|---|
| Dashboard filter | Restricts the view on the current dashboard to events that match the selected criteria. Selections apply to the current dashboard only. See descriptions of the standard filter options. The following domain-specific options are available:
|
| Systems Not Time Synching | Shows a list of systems that have not synchronized their clocks in the specified time frame. |
| Indexing Time Delay | Shows hosts with significant discrepancies between the timestamp the host places on the event and the time that the event appears in Splunk. For example, if the timestamp on an event is later than the time that Splunk indexes the event, the host is timestamping events as future events. A large difference (on the order of hours) indicates improper time zone recognition. |
| NTP Anomalous StartMode | Shows hosts whose Network Time Protocol (NTP) client is not set to automatically start at boot time. |
| Recent Time Synchronization Failures | Shows all hosts where the synchronization client has failed to complete a time sync operation (i.e., was not able to synchronize the clock). This helps identify systems with clients that are unable to complete the time sync operation, such as systems where the specified port has been blocked on the firewall so that time sync fails. |
Endpoint Changes dashboard
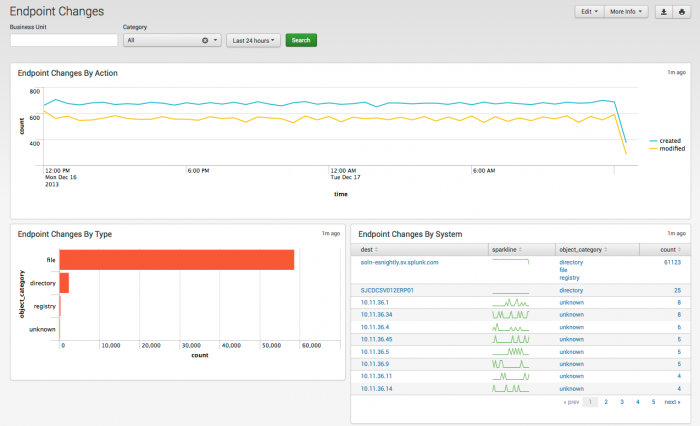
The Endpoint Changes dashboard summarizes the results from the Splunk change monitoring system, which detects file-system and registry changes. The Endpoint Changes dashboard uses the Splunk change monitoring system to illustrate changes and highlight trends. For example, the Endpoint Changes dashboard can help discover and identify a sudden increase in changes that may be indicative of a security incident.
Use the filtering options at the top of the screen to limit which items are shown. Configure new data inputs through the Settings menu, or search for particular systems-related events directly through Incident Review.
Note: Only systems running a Splunk Forwarder will report this information. See "Monitor Windows registry data" and "Monitor changes to your file system" in the core Splunk product documentation to configure fschange.
Clicking on chart elements or table rows on this dashboard will display the raw events that are represented. See dashboard drilldown for more information. The following table describes the panels for this dashboard.
| Panel | Description |
|---|---|
| Dashboard filter | Restricts the view on the current dashboard to events that match the selected criteria. Selections apply to the current dashboard only. See descriptions of the standard filter options. |
| Endpoint Changes by Action | Summarizes changes over time. A substantial increase in changes may indicate the presence of an incident that is causing changes on the endpoints (such as a virus or worm). |
| Endpoint Changes by Type | Summarizes the type of changes observed on the endpoints. |
| Changes by System | Summarizes changes by system |
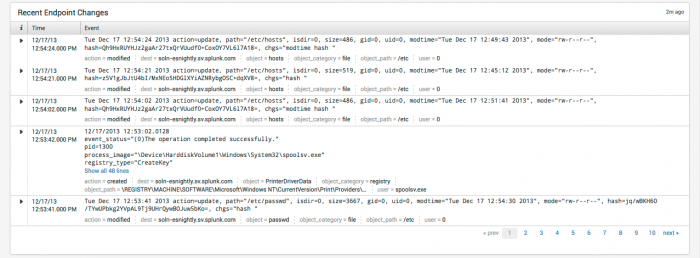
| Recent Endpoint Changes | Shows the most recent endpoint changes observed. |
Update Center dashboard
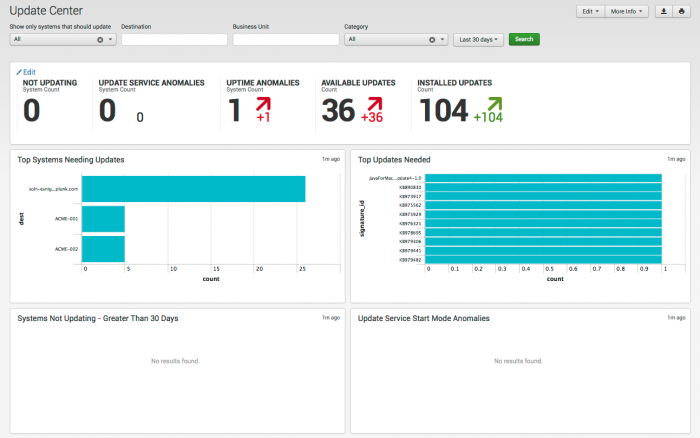
The Update Center dashboard provides additional insight into systems by showing systems that have not been updated. It is a good idea to look at this dashboard periodically - for example, every month - to make sure the systems are updating properly.
Use the filtering options at the top of the screen to limit which events are shown. Configure new data inputs through Splunk Settings.
Note: What is a should_update system? "should_update" systems are denoted by a value of "should_update=true" in the Asset table. The main search controls above contain a filtering option that will include/exclude these systems.
Clicking on chart elements or table rows on this dashboard will display the raw events that are represented. See dashboard drilldown for more information. The following table describes the panels for this dashboard.
| Panel | Description |
|---|---|
| Dashboard filter | Restricts the view on the current dashboard to events that match the selected criteria. Selections apply to the current dashboard only. See descriptions of the standard filter options. The following domain-specific options are available:
|
| Available Updates | Shows updates that are available on the systems, but that have not been installed. |
| Systems Not Updating | Shows systems that have updated in the past, but have not updated recently. |
| Automatic Update Anomalous StartMode | Shows all systems where the update startup task or service is disabled. Administrators sometimes disable automatic update to expedite a restart - for example, during troubleshooting - and forget to re-enable the process |
| Anomalous System Uptime | Shows systems that have not been rebooted in the specified period. Hosts with lengthy uptime may need to be rebooted in order to ensure that security patches are applied. |
| Recent Update Errors | Shows all systems that had an error while updating. |
Update Search dashboard
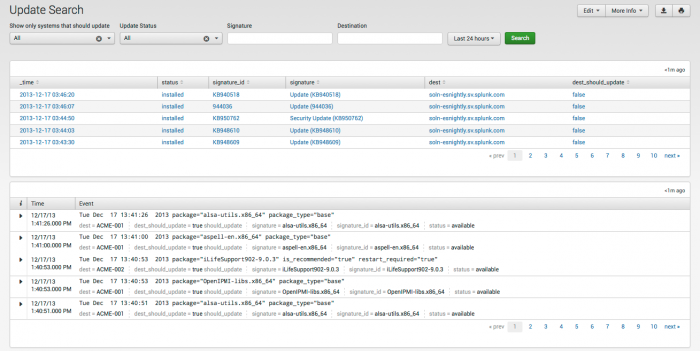
The Update Search dashboard shows patches and updates by package and/or device. This dashboard helps identify which devices have a specific patch installed - for example, when there is a problem possibly caused by a patch and there is need to determine exactly where that patch is deployed.
The following table describes the panels for this dashboard. Drilldown is available for graphs and tables. See dashboard drilldown for more information.
| Panel | Description |
|---|---|
| Dashboard filter | Restricts the view on the current dashboard to events that match the selected criteria. Selections apply to the current dashboard only. See descriptions of the standard filter options. |
| Update summary | Shows patch and update activity by dest, status, package, package_title
|
| raw events | List of raw events found in this search |
| Access dashboards | Network dashboards |
This documentation applies to the following versions of Splunk® Enterprise Security: 3.1, 3.1.1, 3.2, 3.2.1, 3.2.2, 3.3.0, 3.3.1, 3.3.2, 3.3.3
 Download manual
Feedback submitted, thanks!