Predictive Analytics dashboard
Use the Predictive Analytics dashboard to search for different varieties of anomalous events in your data. Predictive Analytics uses the predictive analysis functionality in Splunk to provide statistical information about the results, and identify outliers in your data.
The Predictive Analytics dashboard filters are implemented in a series from left to right. Example: The Object filter is populated based on the Data Model selection. To analyze data with predictive analytics, choose a data model, an object, a function, an attribute, and a time range and click Search.
| Filter | Description | Action |
|---|---|---|
| Data Model | Specifies the data model for the search. Available data models are shown in the drop-down list. | Drop-down: select to filter by |
| Object | Specifies the object within the data model for the search. There must be a Data Model selection to apply an Object. | Drop-down: select to filter in |
| Function | Specifies the function within the object for the search. Functions specify the type of analysis to perform on the search results. For example, choose "avg" to analyze the average of search results. Choose "dc" to create a distinct count of the results.
|
Drop-down: select to filter in |
| Attribute | Specifies the constraint attributes within the object for the search.
Attributes are constraints on the search results. For example, choose " |
Drop-down: select to filter in |
| Time range | Specify the time range for the search | Drop-down: select to filter in |
| Advanced | Access to the advanced predict options. | Link: A window of optional predict settings |
Note: The Predictive Analytics dashboard uses data model accelerations available within the time range chosen. If the data model accelerations are unavailable or incomplete for the chosen time range, the predictive search will revert to searching unaccelerated data sources.
Prediction Over Time
The Prediction Over Time panel shows a predictive analysis of the results over time, based on the time range you chose. The shaded area shows results that fall within two standard deviations of the mean value of the total search results.
Outliers
The Outliers panel shows those results that fall outside of two standard deviations of the search results.
Create a correlation search
From this dashboard, create a correlation search based on the search parameters for your current predictive analytics search. This correlation search will create an alert when the correlation search returns an event.
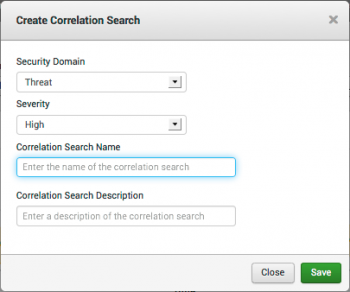
Click Make Correlation Search... to open the Create Correlation Search dialog.
Select the Security domain and Severity for the notable event created by this search. Add a search name and search description. Click Save.
To view and edit correlation searches, go to Configure > General > Custom Searches. See the "Edit Correlation Search page" in the Installation and Configuration manual.
Configuration information
For information on configuring the Predictive Analytics dashboard, see "Predictive Analytics dashboard" in the Splunk App for Enterprise Security Installation and Configuration Manual.
| Notable Event Suppressions | Event Investigator dashboards |
This documentation applies to the following versions of Splunk® Enterprise Security: 3.1, 3.1.1, 3.2, 3.2.1, 3.2.2


 Download manual
Feedback submitted, thanks!