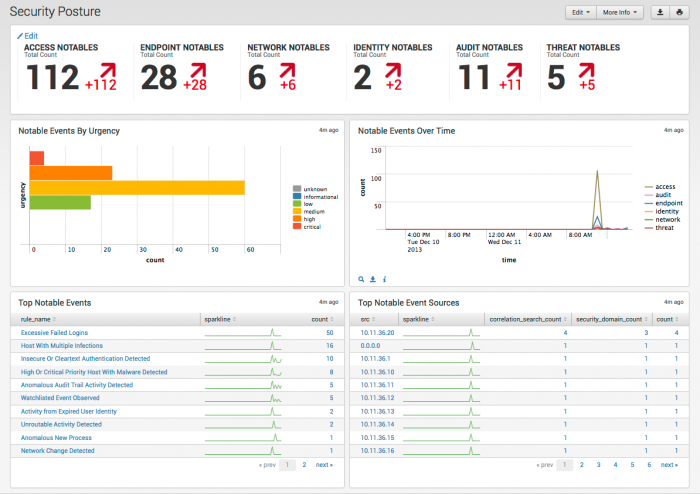
Security Posture dashboard
The Security Posture dashboard is the home screen for the Splunk App for Enterprise Security, designed to provide high-level insight into the notable events across all domains in your deployment, suitable for display in a Security Operations Center (SOC). This dashboard shows all events from the past 24 hours, along with the trends over the past 24 hours, and auto-updates in real time providing real-time information on events.
Dashboard panels
The following table describes the panels for this dashboard. Drill-down is available for graphs and tables. See "dashboard drill-down" for more information.
| Panel | Description |
|---|---|
| Key Indicators: | Displays the count of notable events by security domain over the past 24 hours. |
| Notable Events by Urgency | Displays the notable events by urgency for the last 24 hours. Notable Events by Urgency uses an urgency calculation based on the priority assigned to the asset and the severity assigned to the correlation search. The drilldown redirects the page to the Incident Review dashboard showing all notable events with the selected urgency in the last 24 hours. |
| Notable Events Over Time | Gives a holistic view of notable events. Notable Events by Time: Displays a time line showing when events occurred. The drilldown redirects the page to the Incident Review dashboard showing all notable events in the selected security domain and time frame. |
| Top Notable Events | Displays the top notable events by rule name, each with a sparkline to show increases in notable event counts. |
| Top Notable Event Sources | Displays the top notable events by src, each with a sparkline to show increases in notable event counts.
|
| Key indicators | Incident Review dashboard |
This documentation applies to the following versions of Splunk® Enterprise Security: 3.1, 3.1.1, 3.2, 3.2.1, 3.2.2

 Download manual
Feedback submitted, thanks!