Event Investigator dashboards
The Event Investigator dashboards visually aggregate security-related events by categories over time using swim lanes. Each swim lane represents an event category, such as authentication, malware, or notable events. The swim lane displays periods of high and low activity rendered with a heat map to show event density over time. An analyst can visually link activity across the event categories, and form a complete view of a host or a users interactions in the environment.
Asset Investigator
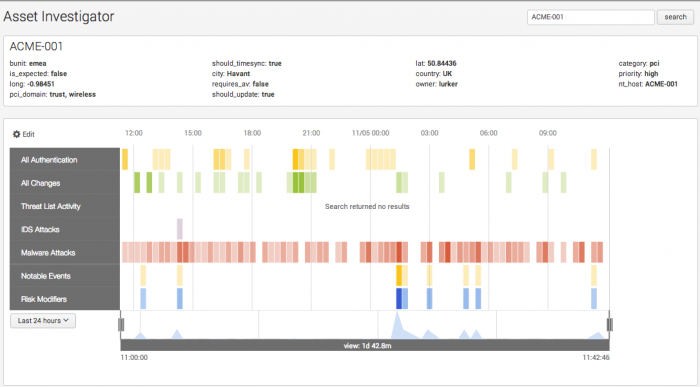
The Asset Investigator dashboard displays information about known or unknown assets across a pre-defined set of event categories, such as malware and notable events.
The asset investigation workflow is initiated through a workflow action from any dashboard that displays events with network source or destination address. For more information, see "Workflow Actions" in this manual.
Additionally, the dashboard is available for ad-hoc searching by browsing to Event Investigator > Asset Investigator in the Enterprise Security app, typing in the host name or IP address in the search bar with an optional wildcard, setting a time range, and choosing Search.
Use the Asset Investigator dashboard
An analyst uses the Asset Investigator dashboard to triage an asset's interactions with the environment.
The dashboard contains multiple event categories bound to swim lanes. Each event category represents a data model with relevant events. For example, the Malware Attacks swim lane displays events from an anti-virus management or other malware data source scoped to the asset searched. Multiple swim lanes are displayed simultaneously to assist the analyst in tracking the actions of an asset across event categories.
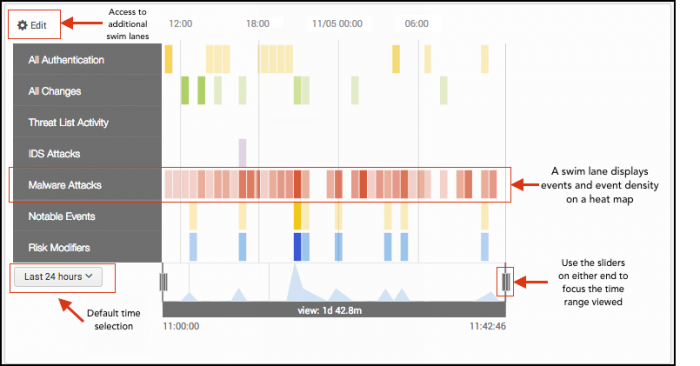
A swim lane represents events displayed over time, with the count of results represented in a heat map. The color saturation on the swim lane communicates the event density for a given time.
A workflow for asset investigation
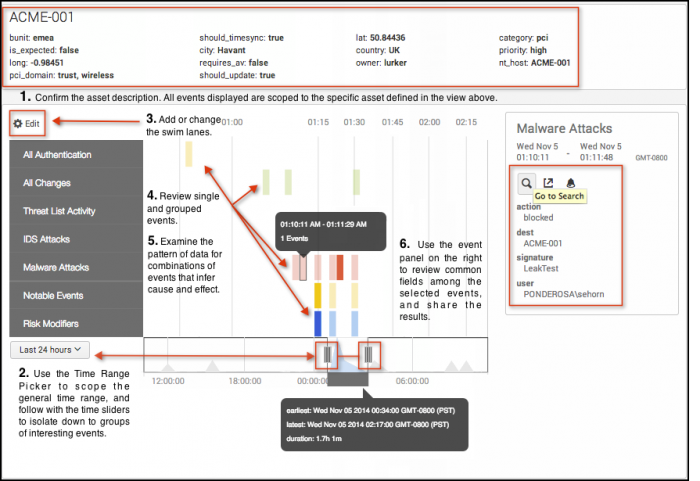
- Confirm the asset description at the top of the dashboard. All events displayed in the swim lanes are scoped to the defined asset.
- Use the Time Range Picker to scope the general time range you are interested in, and follow with the time sliders to isolate periods of interesting events or peak event counts.
- Add or change the swim lanes by using the "Edit" menu. To display data collected about an asset from packet analysis tools, select between the default swim lanes, and the Protocol Intelligence set representing packet capture data.
- After focusing the time range, review the single and grouped events. Upon selecting an event, examine the Event Panel on the right side to view the common fields represented in the individual or grouped events.
- Continue to examine the pattern of events, looking for combinations of events across categories that infer cause and effect over time.
- If there is a event or pattern that must be shared or investigated further, use the Event Panel to select:
- The Go to Search link provides a drilldown to the selected events.
- The Share link offers a link to the current view for sharing.
- The Create Notable Event link opens a dialog box for creating an ad-hoc notable event. See "Notable events" in this manual.
Data sources
The event categories in the Asset Investigation dashboard display events from a number of data models containing an asset or host field. In any given time selection, an asset may not display data in one or more event categories. When a data model search returns no matching events, the swim lane displays "Search returned no results."
Troubleshooting
For information about troubleshooting, see "Troubleshooting Event investigator dashboards" in this topic.
Identity Investigator
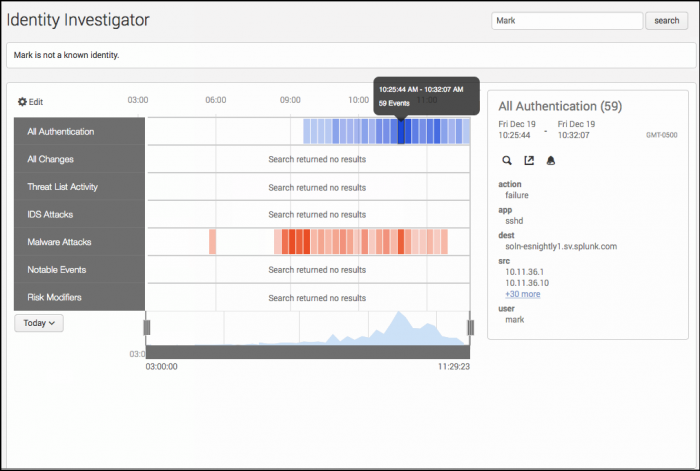
The Identity Investigator dashboard displays information about known or unknown user identities across a pre-defined set of event categories, such as change analysis and malware.
The identity investigation workflow is initiated through a workflow action from any dashboard that displays events with network source or destination address. For more information, see "Workflow Actions" in this manual.
Additionally, the dashboard is available for ad-hoc searching by browsing to Event Investigator > Identity Investigator in the Enterprise Security app, typing in the user credential in the search bar with an optional wildcard, setting a time range, and choosing Search.
Use the Identity Investigator dashboard
An analyst uses the Identity Investigator dashboard to triage a user identity's interactions with the environment.
The dashboard contains multiple event categories bound to swim lanes. Each event category represents a data model with relevant events. For example, the Malware Attacks swim lane displays events from an anti-virus management or other malware data source scoped to the user identity or credential searched. Multiple swim lanes are displayed simultaneously to assist the analyst in tracking the actions of a user across event categories.
A swim lane represents events displayed over time, with the count of results represented in a heat map. The color saturation on the swim lane communicates the event density for a given time.
A workflow for identity investigation
- Confirm the identity description at the top of the dashboard. All events displayed in the swim lanes are scoped to the defined identity.
- Use the Time Range Picker to scope the general time range you are interested in, and follow with the time sliders to isolate periods of interesting events or peak event counts.
- Add or change the displayed swim lanes by using the "Edit" menu. To display identity information collected for user activity monitoring, select between the default swim lanes and the User Activity collection.
- After focusing the time range, review any single and grouped events. Upon selecting an event, examine the Event Panel on the right side to view the common fields represented in the individual or grouped events.
- Continue to examine the pattern of events, looking for combinations of events across categories that can infer cause and effect over time.
- If there is a event or pattern that must be shared or investigated further, use the Event Panel to select:
- The Go to Search link provides a drilldown to the selected events.
- The Share link offers a link to the current view for sharing.
- The Create Notable Event link opens a dialog box for creating an ad-hoc notable event. See "Notable events" in this manual.
Data sources
The event categories in the Identity Investigation dashboard display events from a number of data models containing a identity or user field. In any given time selection, an identity may not display data in one or more event categories. When a data model search returns no matching events, the swim lane displays "Search returned no results."
Troubleshooting
For information about troubleshooting, see "Troubleshooting Event investigator dashboards" in this topic.
Edit the swim lanes
An analyst has the option of adding or removing swim lanes displayed on the Entity Investigator dashboards. Choosing Edit at the top of the dashboard opens the Edit Lanes customization menu. Use this menu to add or remove the swim lanes displayed, or to change the colors used to represent events in the selected lane. Modifying the swim lane order is a drag-and-drop action on the Entity Investigator dashboards, and does not require the Edit Lanes menu.
The Asset Investigator has additional, optional swim lanes in the collection Protocol intelligence to display data collected about an asset using packet analysis tools. The Identity Investigator has additional, optional swim lanes in the collection User Activity to display data collected about an identity for user activity monitoring.
| Swimlane Name | Asset or Identity dashboard | Description |
|---|---|---|
| All Authentication | Both | Matches events in the Authentication data model. |
| All Changes | Both | Matches events in the Change Analysis data model. |
| Threat List Activity | Both | Matches events in the Threat Lists data model. |
| IDS Attacks | Both | Matches events in the Intrusion Detection data model. |
| Malware Attacks | Both | Matches events in the Malware data model. |
| Notable Events | Both | Matches events in the Notable index. |
| Risk Modifiers | Both | Matches events in the Risk Analysis data model. |
| DNS Errors | Asset only | Matches events in the Network Resolution DNS data model. |
| Cloud Emails | Asset only | Matches events in the Email data model. |
| SSL Expired Certs | Asset only | Matches events in the Certificates data model. |
| HTTP Errors | Asset only | Matches events in the Web data model. |
| Non-corporate Emails | Identity only | Matches events in the Email data model. |
| Non-corporate Web Uploads | Identity only | Matches events in the Web data model. |
| Remote Access | Identity only | Matches events in the Authentication data model. |
| Ticket Activity | Identity only | Matches events in the Ticket Management data model. |
| Watchlisted Sites | Identity only | Matches events in the Web data model. |
Troubleshooting Event Investigator dashboards
1. The Event Investigator dashboards display events from the data model named in each swim lane. When a data model search returns no matching events, the swim lane displays "Search returned no results." For example, even if the asset being searched is a defined object in the Asset list, that does not guarantee that there are matching events for that asset in any data model; and the swim lane will display "Search returned no results." Without the applicable data, the swim lanes will remain empty.
2. Determine if any data required for the swim lane is available in the data model.
- Browse to Configure > General > Custom Searches. Sort by the Type column, and select the Entity investigator search that matches the Asset or Identity investigator swim lane you are investigating. In the Edit Swimlane Search page, copy the contents of the Search field. Open a new Search window and paste the swim lane search results in. Remove the portion of the search:
where $constraints$ by _time span=$span$, select a reasonable time range, and choose Search.
3. Validate the data model is being accelerated.
- In the Splunk App for Enterprise Security, browse to Audit > Data Model Audit. Review the Acceleration Details panel for information about the data model acceleration status.
- Note: For more information about data model acceleration and the Enterprise Security App, see "Data models in the Enterprise Security app" in the Installation and Configuration Manual.
4. Validate the required asset and identities information is available in Enterprise Security. For more information, see "Identity Manager" in the Installation and Configuration Manual.
| Predictive Analytics dashboard | Risk Analysis |
This documentation applies to the following versions of Splunk® Enterprise Security: 3.3.0, 3.3.1, 3.3.2, 3.3.3


 Download manual
Feedback submitted, thanks!