Network dashboards
The Network Protection domain provides insight into the network and network-based devices, including routers, switches, firewalls, and IDS devices. This domain aggregates all the traffic on the network, including overall volume, specific patterns of traffic, what devices or users are generating traffic, and per-port traffic. It also shows results from the vulnerability scanners on the network.
Traffic Center dashboard
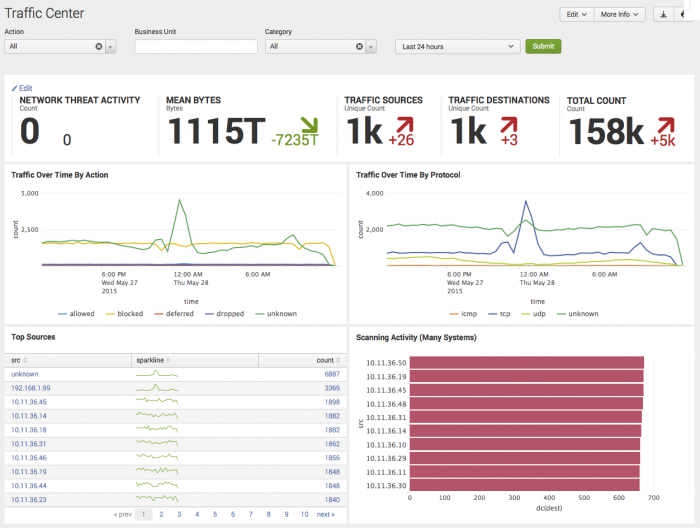
The Traffic Center dashboard profiles overall network traffic, helps detect trends in type and changes in volume of traffic, and helps to isolate the cause (for example, a particular device or source) of those changes. This helps determine when a traffic increase is a security issue and when it is due to an unrelated problem with a server or other device on the network.
Use the filtering options at the top of the screen to limit which items are shown. Configure new data inputs through the Settings menu or search for particular network intrusion events directly through Incident Review.
| Filter by | Description | Action |
|---|---|---|
| Action | Filter based upon firewall rule actions. | Drop-down: select to filter by |
| Business Unit | A group or department classification for the identity. | Text field. Empty by default. Wildcard strings with an asterisk (*) |
| Category | Filter based on the categories to which the host belongs. For more information, see "Dashboard Filters" in the Installation and Configuration manual | Drop-down: select to filter by |
| Time Range | Select the time range to represent. | Drop-down: select to filter by |
Dashboard Panels
| Panel | Description |
|---|---|
| Key Indicators | Displays the metrics relevant to the dashboard sources over the past 24 hours. Key indicators represent summary information and appear at the top of the dashboard. See "Key indicators" in this manual. |
| Traffic Over Time by Action | Displays network traffic by action. The drilldown redirects the page to the "Traffic Search" dashboard and searches on the selected action and time range. |
| Traffic Over Time By Protocol | Displays the number of events per day for a specified protocol. The drilldown redirects the page to the "Traffic Search" dashboard and searches on the selected protocol and time range. |
| Top Sources | Displays the top sources of total traffic volume over the given time frame with a sparkline representing peak event matches. The drilldown redirects the page to the "Traffic Search" dashboard and searches on the selected source IP and time range. |
| Scanning Activity (Many Systems) | Displays network activity from port scanners or vulnerability scanners and helps identify non-authorized instances of these scanners. The drilldown redirects the page to the "Traffic Search" dashboard and searches on the selected source IP and time range. |
Troubleshooting
For information about troubleshooting, see "Troubleshooting Network dashboards" in this topic.
Traffic Search dashboard
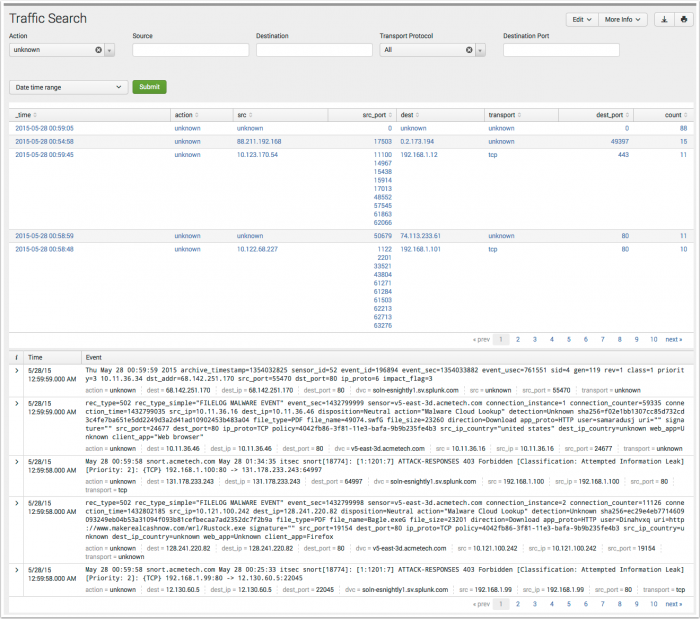
The Traffic Search dashboard assists in searching network protocol data, based upon the criteria defined by the search filters. The dashboard is used in ad-hoc searching of network data, but is also the primary destination for drilldown searches used in the Traffic Center dashboard panels.
The Traffic Search dashboard displays no results by default unless it was opened in response to a drilldown action, or the user updates a filter, selects a time range, and chooses Submit.
| Filter by | Description | Action |
|---|---|---|
| Action | Filter based upon firewall rule actions. | Drop-down: select to filter by |
| Source | Filter based upon source IP or name. | Text field. Empty by default. Wildcard strings with an asterisk (*) |
| Destination | Filter based upon destination IP or name. | Text field. Empty by default. Wildcard strings with an asterisk (*) |
| Transport Protocol | Filter based upon transport protocol. | Drop-down: select to filter by |
| Destination port | Filter based upon destination host port. | Text field. Empty by default. Wildcard strings with an asterisk (*) |
| Time Range | Select the time range to represent. | Drop-down: select to filter by |
Intrusion Center dashboard
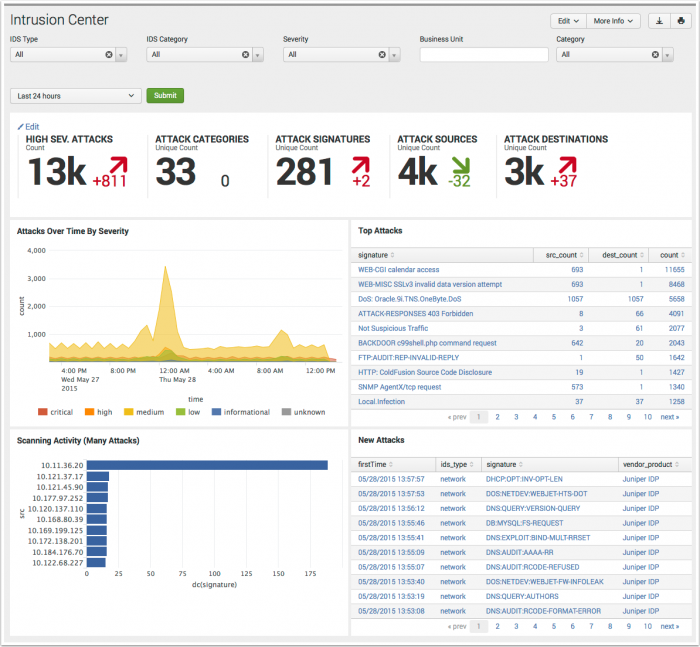
The Intrusion Center provides an overview of all network intrusion events from the Intrusion Detection Systems (IDS) and Intrusion Prevention Systems (IPS) device data. This dashboard assists in reporting on IDS activity to display trends in severity and changes in volume of IDS event.
| Filter by | Description | Action |
|---|---|---|
| IDS Type | Filter based upon events matching a specified type of IDS. | Drop-down: select to filter by |
| IDS Category | Filter based upon events matching vendor-defined categories. | Drop-down: select to filter by |
| Severity | Filter based upon event severity. | Drop-down: select to filter by |
| Business Unit | A group or department classification for the identity. | Text field. Empty by default. Wildcard strings with an asterisk (*) |
| Category | Filter based on the categories to which the host belongs. For more information, see "Dashboard Filters" in the Installation and Configuration manual | Drop-down: select to filter by |
| Time Range | Select the time range to represent. | Drop-down: select to filter by |
Dashboard Panels
| Panel | Description |
|---|---|
| Key Indicators | Displays the metrics relevant to the dashboard sources over the past 24 hours. Key indicators represent summary information and appear at the top of the dashboard. See "Key indicators" in this manual. |
| Attacks Over Time By Severity | Displays the top attacks over time by severity. The drilldown redirects the page to the "Intrusion Search" dashboard and searches on the selected severity and time range. |
| Top Attacks | Displays the top attacks by count and signature. The drilldown redirects the page to the "Intrusion Search" dashboard and searches on the selected signature. |
| Scanning Activity (Many Attacks) | Displays source IP's showing a pattern of attacks. The drilldown redirects the page to the "Intrusion Search" dashboard and searches on the selected source IP and time range. |
| New Attacks | Displays attacks that have been identified for the first time. New attack vectors indicate that a change has occurred on the network, potentially due to the presence of a new threat, such as a new malware infection. The drilldown redirects the page to the "Intrusion Search" dashboard and searches on the selected signature and time range. |
Troubleshooting
For information about troubleshooting, see "Troubleshooting Network dashboards" in this topic.
Intrusion Search dashboard
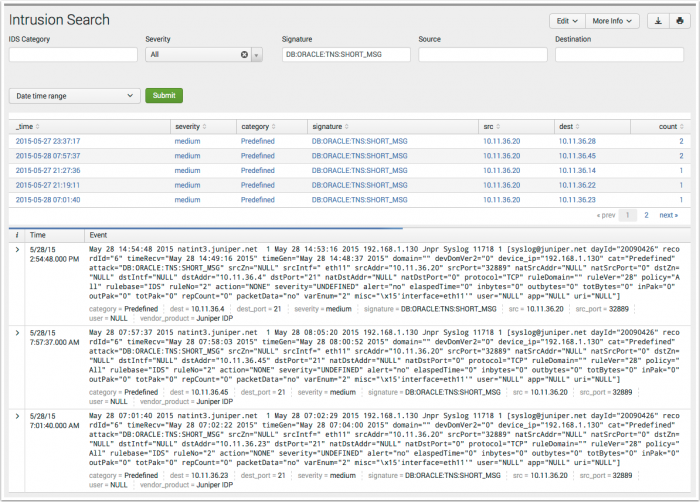
The Intrusion Search dashboard assists in searching IDS-related events such as attacks or reconnaissance-related activity, based upon the criteria defined by the search filters. The dashboard is used in ad-hoc searching of network data, but is also the primary destination for drilldown searches used in the Intrusion Center dashboard panels.
The Intrusion Search dashboard displays no results by default unless it was opened in response to a drilldown action, or the user updates a filter, selects a time range, and chooses Submit.
| Filter by | Description | Action |
|---|---|---|
| IDS Category | Filter based upon events matching vendor-defined categories. | Drop-down: select to filter by |
| Severity | Filter based upon event severity. | Drop-down: select to filter by |
| Signature | Filter based upon IDS signature name. | Text field. Empty by default. Wildcard strings with an asterisk (*) |
| Source | Filter based upon source IP or name. | Text field. Empty by default. Wildcard strings with an asterisk (*) |
| Destination | Filter based upon destination IP or name. | Text field. Empty by default. Wildcard strings with an asterisk (*) |
| Time Range | Select the time range to represent. | Drop-down: select to filter by |
Vulnerability Center dashboard
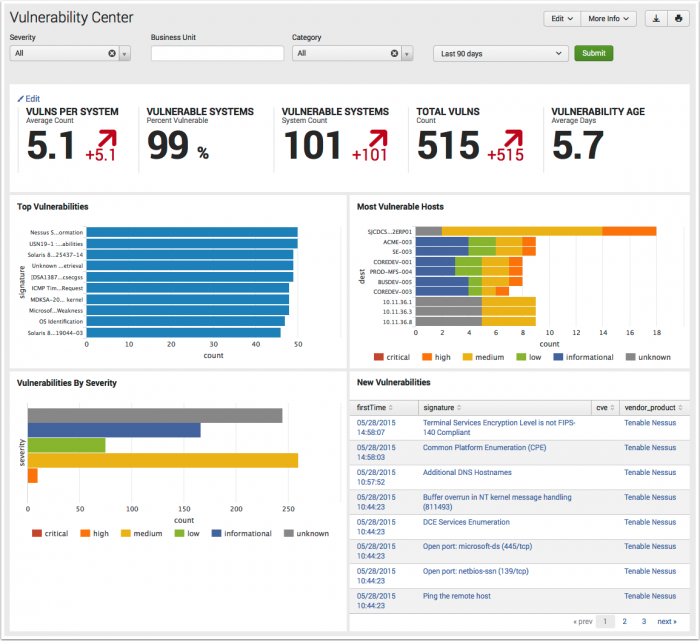
The Vulnerability Center provides an overview of vulnerability events from device data.
| Filter by | Description | Action |
|---|---|---|
| Severity | Filter based upon event severity. | Drop-down: select to filter by |
| Business Unit | A group or department classification for the identity. | Text field. Empty by default. Wildcard strings with an asterisk (*) |
| Category | Filter based on the categories to which the host belongs. For more information, see "Dashboard Filters" in the Installation and Configuration manual | Drop-down: select to filter by |
| Time Range | Select the time range to represent. | Drop-down: select to filter by |
Dashboard Panels
| Panel | Description |
|---|---|
| Key Indicators | Displays the metrics relevant to the dashboard sources over the past 24 hours. Key indicators represent summary information and appear at the top of the dashboard. See "Key indicators" in this manual. |
| Top Vulnerabilities | Displays the most common issues reported by the vulnerability scanners. The reported issues are aggregated by host so that the chart represents the number of unique occurrences of the issue as opposed to the number of times the issue was detected (since scanning a single host multiple times will likely reveal the same vulnerabilities each time). The drilldown redirects the page to the "Vulnerability Search" dashboard and searches on the selected signature and time range. |
| Most Vulnerable Hosts | Displays the hosts with the highest number of reported issues. The drilldown redirects the page to the "Vulnerability Search" dashboard and searches on the selected severity, host, and time range. |
| Vulnerabilities by Severity | Displays issues by the severity assigned by the vulnerability scanner. Helps identify trends that are not visible when looking at vulnerabilities individually. The drilldown redirects the page to the "Vulnerability Search" dashboard and searches on the selected severity and time range. |
| First Time Vulnerabilities | Displays the most recent new vulnerabilities detected as well as the date each one was first observed. Helps identify new issues appearing on the network that need to be investigated as potential new attack vectors. The drilldown redirects the page to the "Vulnerability Search" dashboard and searches on the selected signature and time range. |
Troubleshooting
For information about troubleshooting, see "Troubleshooting Network dashboards" in this topic.
Vulnerability Operations dashboard
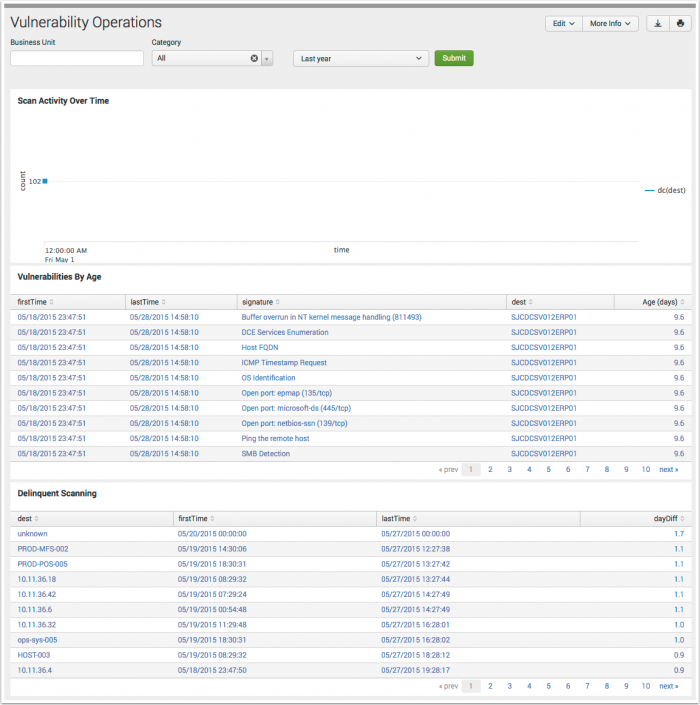
The Vulnerability Operations dashboard tracks the status and activity of the vulnerability detection products deployed in your environment. Use this dashboard to see the overall health of your scanning systems, to identify long-term issues, and also see systems that are no longer being scanned for vulnerabilities.
| Filter by | Description | Action |
|---|---|---|
| Business Unit | A group or department classification for the identity. | Text field. Empty by default. Wildcard strings with an asterisk (*) |
| Category | Filter based on the categories to which the host belongs. For more information, see "Dashboard Filters" in the Installation and Configuration manual | Drop-down: select to filter by |
| Time Range | Select the time range to represent. | Drop-down: select to filter by |
Dashboard Panels
| Panel | Description |
|---|---|
| Scan Activity Over Time | Displays vulnerability scan activity by systems over time. Hover over item for details. The drilldown redirects the page to the "Vulnerability Search" dashboard and searches on the selected time range. |
| Vulnerability by Age | Displays detected vulnerabilities by age, with signature, destination, and event time. Click an item to view in the Vulnerability Profiler for more detail. The drilldown redirects the page to the "Vulnerability Search" dashboard and searches on the selected signature or destination host, and time range. |
| Delinquent Scanning | Displays vulnerability scans with a severity of "high". Includes signature. The drilldown redirects the page to the "Vulnerability Search" dashboard and searches on the selected destination host and time range. |
Vulnerability Search dashboard
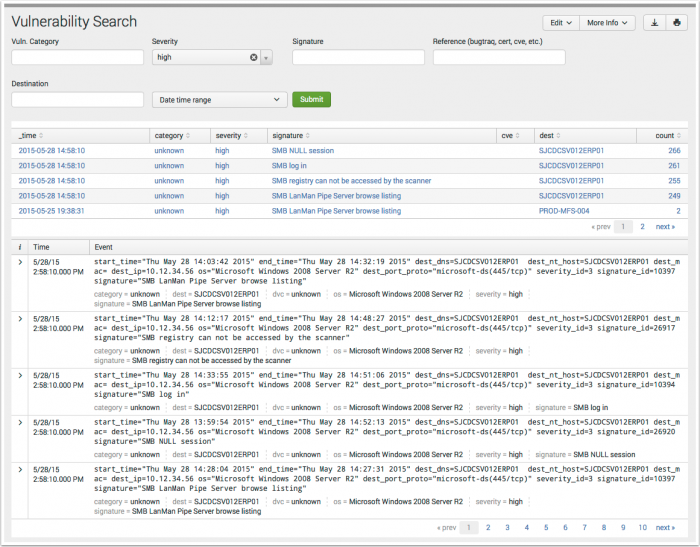
The Vulnerability Search dashboard displays a list of all vulnerability-related events based upon the criteria defined by the search filters. The dashboard is used in ad-hoc searching of vulnerability data, but is also the primary destination for drilldown searches used in the Vulnerability Center dashboard panels.
The Vulnerability Search dashboard displays no results by default unless it was opened in response to a drilldown action, or the user updates a filter, selects a time range, and chooses Submit.
| Filter by | Description | Action |
|---|---|---|
| Vuln. category | Filter based upon events matching vendor-defined categories. | Drop-down: select to filter by |
| Severity | Filter based upon event severity. | Drop-down: select to filter by |
| Signature | Filter based upon vendor signature name. | Text field. Empty by default. Wildcard strings with an asterisk (*) |
| Reference (bugtraq, cert, cve, etc.) | Filter based upon common reference standards. | Text field. Empty by default. Wildcard strings with an asterisk (*) |
| Destination | Filter based upon destination IP or name. | Text field. Empty by default. Wildcard strings with an asterisk (*) |
| Time Range | Select the time range to represent. | Drop-down: select to filter by |
Troubleshooting Network Dashboards
1. This dashboard references data from various data models. Without the applicable data, the dashboards will remain empty.
2. Use the Open in Search link available in the lower left corner of a dashboard view to perform a direct search against the data model. The New Search dashboard also exposes the search commands and objects used to populate the view.
3. Determine if any data required for a dashboard is available in the data model.
- a. Determine the data model objects used by a dashboard:
Dashboard Name Panel Title Data Model Data Model Object Traffic Center Traffic Over Time By Action Network Traffic All_Traffic.action Traffic Over Time By Protocol All_Traffic.transport Scanning Activity (Many Systems) All_Traffic.dest, .src Top Sources All_Traffic.src Traffic Search All_Traffic.action, .src_port, .src, .dest, .transport, .dest_port Intrusion Center Attacks Over Time By Severity Intrusion Detection IDS_Attacks.severity Top Attacks IDS_Attacks.dest, .src, .signature Scanning Activity (Many Attacks) IDS_Attacks.signature New Attacks IDS_Attacks.ids_type Intrusion Search IDS_Attacks.severity, .category, .signature, .src, .dest Vulnerability Center Top Vulnerabilities Vulnerabilities Vulnerabilities.signature, .dest Most Vulnerable Hosts Vulnerabilities.signature, .severity, .dest Vulnerabilities By Severity Vulnerabilities.signature, .severity, .dest New Vulnerabilities Calls vuln_signature_reference lookup Vulnerability Operations Scan Activity Over Time Vulnerabilities Vulnerabilities.dest Vulnerabilities By Age Vulnerabilities.severity, .signature, .dest Delinquent Scanning Vulnerabilities.dest Vulnerability Search Vulnerabilities.category, .signature, .dest, .severity, .cve,
- b. Use the data model and data model object to search for events in the data model:
Action Search Expected Result Verify the data is normalized to the Common Information Model | datamodel data_model_name root_object_name search | table _time, sourcetype, root_object_name.* Example: | datamodel Network_Traffic All_Traffic search | dedup sourcetype | table _time, sourcetype, All_Traffic.*
Returns a list of sourcetypes and the data model objects and fields populated by that sourcetype.
4. Validate the data model is being accelerated.
- In the Splunk App for Enterprise Security, browse to Audit > Data Model Audit. Review the Acceleration Details panel for information about the data model acceleration status.
- Note: For more information about data model acceleration and the Enterprise Security App, see "Data models in the Enterprise Security app" in the Installation and Configuration Manual.
| Endpoint dashboards | More Network dashboards |
This documentation applies to the following versions of Splunk® Enterprise Security: 3.3.0, 3.3.1, 3.3.2, 3.3.3
 Download manual
Feedback submitted, thanks!