Manual notable event creation
The Splunk App for Enterprise Security uses the concept of notable events to reveal security posture and support and incidence response workflow. The Security Posture and Incident Review dashboards are used to display and interact with notable events.
These dashboards aggregate significant security events across the environment. To reduce the amount of effort required to search through your security events for incidents, the Splunk App for Enterprise Security uses special Splunk searches called correlation searches to detect patterns in your data and identify security issues that require investigation. If a suspicious pattern is detected, Enterprise Security creates a special event called a "notable event", and places it on the Incident Review dashboard.
Attributes of correlation searches can be tuned, such as alerting behavior or the threshold - individual events that will trigger a notable event. Have your Enterprise Security administrator refer to "Configure Correlation Searches" in the Splunk App for Enterprise Security Installation and Configuration Manual for more information.
Custom correlation searches can use the Splunk search language; for more information, see Get started with Search in the core Splunk product documentation.
Notable events
When a correlation search detects suspicious behavior, it creates a "notable event" -- a single event that aggregates the information in the individual events that triggered the notable event. Notable events are stored in a special index, separate from the events in the environment.
Notable events are managed on the Incident Review dashboard, which allows security analysts to review and track notable events. Here notable events can be filtered, assigned a review status, assigned to a specific security analyst, and notes can be entered about the incident. See "Incident Review dashboard" in this manual for more information.
Manual notable event creation
A new notable event can be created from an event you are viewing in the Access Search, Malware Search, Traffic Search, Intrusion Search, Proxy Search, or Search dashboards.
Create a new notable event from an existing event shown as part of a search result or by using New Notable Event in the Configure panel.
Note: Do not create a new notable event from an existing notable event. For instance, do not create a new notable event from an event shown on the Incident Review dashboard.
Create a notable event from existing event
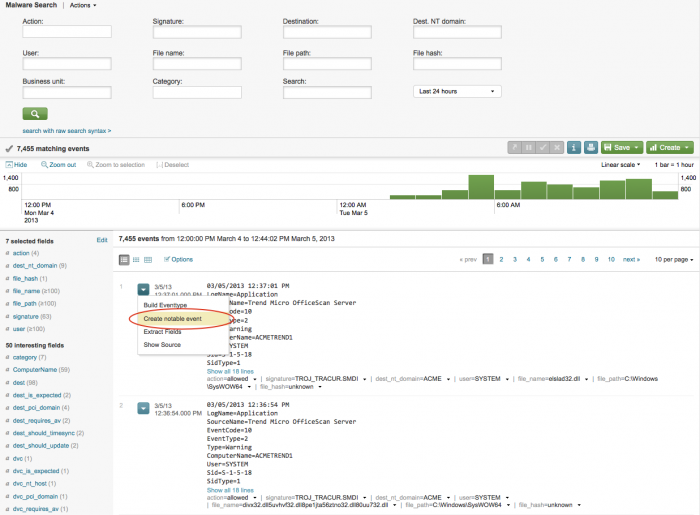
To create a new notable event from an event in the Malware Search dashboard:
1. Finalize the search in the Malware Search dashboard.
2. Select "Create notable event" from the Options menu for the event. A notable event is created using parameters of the selected event.
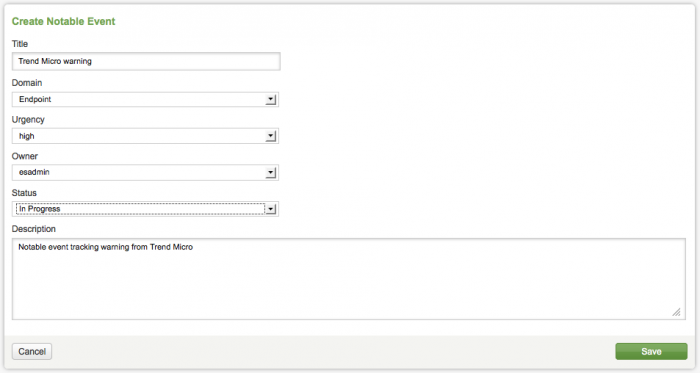
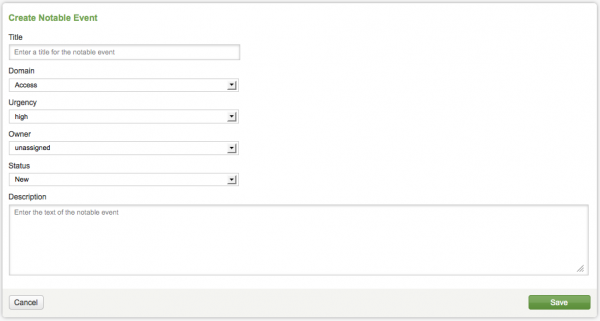
3. In the Create Notable Event form, add a title and description for the new notable event.
Use the drop-down options in the form to set the values for the other fields. Select the appropriate Domain, Urgency, Owner, and Status for the notable event.
Options for the notable event fields:
| Field | Description |
|---|---|
| Title | Name for notable event |
| Domain | Access, Audit, Endpoint, Identity, Network, or Threat |
| Urgency | Level of severity: Informational, Low, Medium, High, Critical |
| Owner | unassigned, Administrator, esadmin, esanalyst |
| Status | Unassigned, New, In Progress, Pending, Resolved, Closed |
| Description | Purpose of the notable event |
4. Click Save.
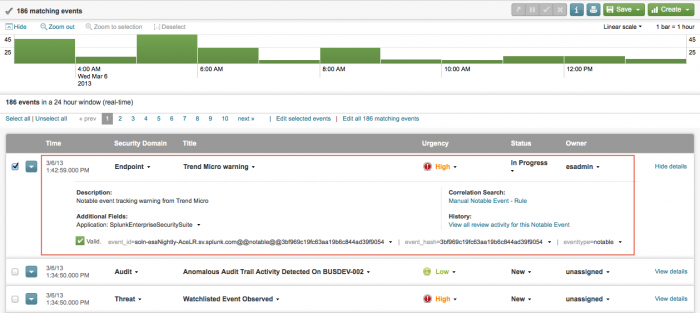
When you successfully create the notable event, an event is logged showing that a new event was created. View the new notable event in the Incident Review dashboard.
Create new notable event from the Configure panel
A non-administrator role, such as an ES analyst, needs to have an administrator grant additional permissions to the role, in order to manually create and edit a new notable event.
To add the permissions to the ess_analyst role, an administrator would do the following:
1. In Splunk Web, choose Settings > Access Controls > Roles.
2. Click on the ess-analyst role (in the list of roles) to open the editor.
3. In the "Capabilities" section, add edit_tcp to the Selected capabilities.
4. Click Save.
After this is done, an ES analyst can create a new notable event from the Configure panel in the Splunk App for Enterprise Security. To do this:
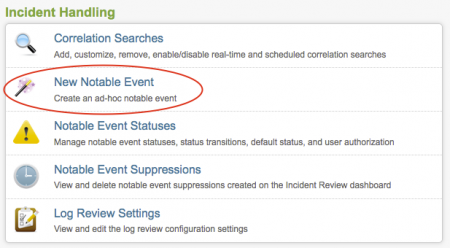
1. In the Enterprise Security interface, go to Configure > Incident Handling > New Notable Event.
2. Click New Notable Event.
3. Use the Create Notable Event panel to add a title and description for the new notable event.
4. Modify the default field values for the notable event with the drop-down field options. Select the appropriate Domain, Urgency, Owner, and Status.
5. Click Save.
| Incident Review dashboard | Notable Event Suppressions |
This documentation applies to the following versions of Splunk® Enterprise Security: 3.1, 3.1.1, 3.2, 3.2.1, 3.2.2, 3.3.0, 3.3.1, 3.3.2, 3.3.3

 Download manual
Feedback submitted, thanks!