Build custom dashboards to analyze risk
You can build custom dashboards to track changes, analyze risk, and reduce alert volume in addition to using the Risk Analysis dashboard in Splunk Enterprise Security. Custom dashboards help to present security information for both basic and complex risk investigations so that analysts can track where risk is building up in the security environment. You can make changes to the dashboards and the searches behind dashboard panels to make them more relevant to your organization and security use cases. Dashboards can help you to elevate isolated risk events to tell a context-rich security story that helps the analyst make decisions during an investigation.
Download and install the Splunk Dashboard app from Splunkbase to learn the basic concepts and tools needed to create custom dashboards using Simple XML.
Following are examples of some custom dashboards that you can build to take maximum advantage of RBA using Splunk Enterprise Security:
- Dashboard for streamlining risk analysis and risk notable investigations.
- Dashboard to reduce alert volume using allowlists and lookups
- Dashboards using the MITRE ATT&CK Framework for compliance and triage with drill-down capabilities
You can download and install the MITRE ATTACK App for Splunk from Splunkbase to build these dashboards. - Dashboards to evaluate the matrix for your security operations center (SOC) by comparing traditional alerting with risk-based alerting
Create a new dashboard to display all the risk rules
Follow these steps to build a dashboard called "Risk Notable Analysis" to display all the risk rules to streamline risk analysis and risk notable investigations:
- On the Splunk Search and reporting app, navigate to the Dashboards panel.
- Select Create New Dashboard.
- In the Create New Dashboard panel, enter a title for your dashboard such as "Risk Notable Analysis".
- Select +Add Input > Time to add a time picker to the dashboard.
- Select +Add Input > Submit to add a Submit button to the dashboard.
- Select the pencil Edit button on the time picker to add a recognizable token name such as time_picker.
- Select +Add Panel > New > Statistics Table to create a new statistics panel to show what searches are generating the most risk.
- In Time Range, enter Shared Time Picker (time_picker).
- In Content Title, enter Risk Rules.
- In Search String, enter the following search:
| tstats summariesonly=false sum(All_Risk.calculated_risk_score) as risk_score,dc(All_Risk.risk_object) as risk_objects,count FROM datamodel=Risk.All_Risk WHERE * All_Risk.risk_object_type="*" (All_Risk.risk_object="*" OR risk_object="*") BY source | sort 1000 - count risk_score - Select Add to Dashboard.
Create a drill down to investigate a specific risk rule
Follow these steps to create a drill down called "$risk_drilldown$" to investigate the risk associated with a specific risk rule so that you can adjust it to meet the requirements of your security environment:
- On the Splunk Search and reporting app, navigate to the Dashboards panel.
This displays all the available dashboards. - Go to the "Risk Notable Analysis" dashboard that you created.
- Select +Add Panel > New > Statistics Table to create another statistics panel.
- In Time Range, enter Shared Time Picker (time_picker).
- In Content Title, enter $risk_drilldown$.
- In Search String, enter the following search and replace the value for source with a token:
| tstats summariesonly=true count dc(All_Risk.risk_object) as dc_objects dc(All_Risk.src) as dc_src dc(All_Risk.dest) as dc_dest dc(All_Risk.user) as dc_users dc(All_Risk.user_bunit) as dc_bunit sum(All_Risk.calculated_risk_score) as risk_sum values(All_Risk.calculated_risk_score) as risk_scores FROM datamodel=Risk.All_Risk WHERE source="$risk_drilldown$" BY All_Risk.threat_object,All_Risk.threat_object_type | `drop_dm_object_name("All_Risk")` | sort 1000 - risk_sum - Create a drilldown by selecting the three dots and select Edit Drilldown.
- In the Drilldown Editor, select On Click > Manage tokens on the Dashboard".
- Configure Set > risk_drilldown >token value to $click.value$.
This example uses $click.value$ so when a field is selected, it uses the search name in the first column to populate the $risk_drilldown$ token.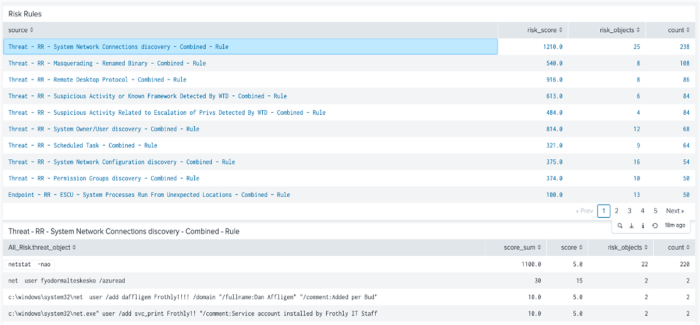
This example shows that "netstat -nao" adds a lot of risk and might be adjusted to identify real risk.

You also have the option to add color to your dashboards. Adding colors that have specific meanings using simple XML can help you to track risk.
For example, you can add some color to the threat_object field in the Threat Object panel as follows:
<format type="color" field="threat_object">
<colorPalette type="list">[#a7c4f2]</colorPalette>
</format>

See also
For more information on creating custom dashboards, see the product documentation:
Customize Splunk Enterprise Security dashboards to fit your use case in the Use Splunk Enterprise Security manual
Create a dashboard in the Splunk® Enterprise Dashboards and Visualizations manual
| Creating lookups to reduce noisy alert volume | Prioritizing threat objects over risk objects in risk incident rules |
This documentation applies to the following versions of Splunk® Enterprise Security: 7.1.0, 7.1.1, 7.1.2, 7.2.0, 7.3.0, 7.3.1, 7.3.2, 7.3.3
Feedback submitted, thanks!