How behavioral analytics service calculates risk scores
A risk score is an indication of how likely an entity is an actual threat. For example, an entity with a risk score of 65 is more likely to represent a threat activity than an entity with a risk score of 35. Behavioral analytics service uses anomalies along with notable events and risk-based alerting (RBA) events from Splunk Enterprise Security (ES) in Splunk Cloud Platform to generate risk scores for any entity.
Why normalize entity risk scores in behavioral analytics service
Normalize entity risk scores so that they are not empirical scores, but a percentile ranking. The entity with the highest risk score has a score of 100. Other entities have a risk score that is a percentage based on the highest risk score. For example, an analyst can't quickly judge an entity with a risk score of 90 unless they compare that entity with other entities and their risk scores. However, a normalized risk score of 90 out of 100 has immediate context and requires immediate investigation.
Normalizing risk scores is also important because each organization has different risk profiles due to varying data sources and detections. A risk score of 90 in one organization might mean something different than the same score in a different organization.
Consider the following example, where without normalization, entity risk scores can increase:
- At 8:00 AM, an executive's laptop receives an entity score of 80.
- At 10:00 AM, many more anomalies are in the system, so a different employee's laptop gets an entity score of 240.
- As the number of anomalies continues to increase, the entity scores also increase, to the point where the executive's laptop risk score of 80 is no longer considered important.
In such a scenario, given that the executive's laptop is a high-value target and a higher risk compared to the other laptops in the organization, the risk score needs to reflect the same. Normalizing risk scores causes risk scores in your system to be relatable among all entities in your system so that there is a connection between the entity's risk score and how risky the entity is.
View entity risk scores in either 24-hour or 7-day compute windows.
How behavioral analytics service normalizes risk scores
Behavioral Analytics service uses a probabilistic method based on quantiles to calculate and normalize risk scores.
- Periodic quantile cutoff points get calculated for pre-determined quantiles
- Determine the corresponding quantile for any risk score
- Use linear rescaling within the quantile bounds to normalize the score
- Perform a lookup to find the corresponding risk level for the normalized score
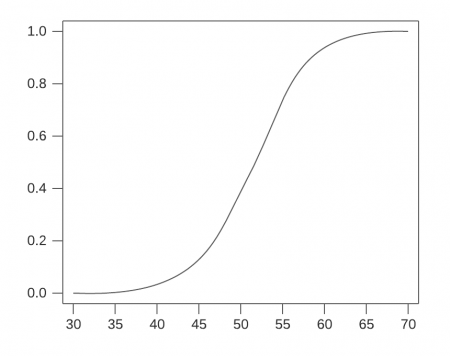
For example, the following graph shows a cumulative distribution function (CDF) of probability for a tenant. Each tenant has a different graph, depending on the data ingested in its environment. The horizontal axis of the graph represents the distribution of raw entity scores, and the vertical axis represents the CDF value:
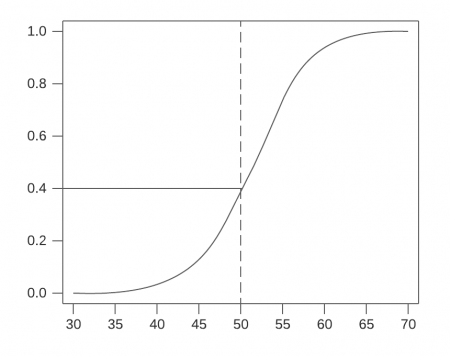
To see this graph, use an example raw entity score of 50, as shown in the following example. The corresponding vertical axis value based on the graph is 0.4, meaning that 40% of the risk scores in this tenant's system are less than or equal to 50.
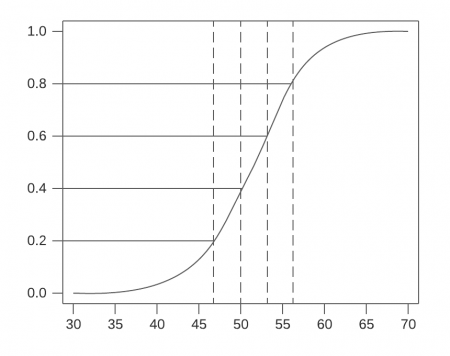
Pre-determined quantile cutoff points group the risk scores as a percentage. In the following example, there are four cutoff points:
- 20% of the scores are less than or equal to 47
- 40% of the scores are less than or equal to 50
- 60% of the scores are less than or equal to 53
- 80% of the scores are less than or equal to 57
Cutoff points get stored in a database and recalculated hourly as the overall distribution of risk scores change over time, due to entities getting new detections associated with them. As a result, entity scores are also recomputed hourly as a result of shifting quantile cutoff points.
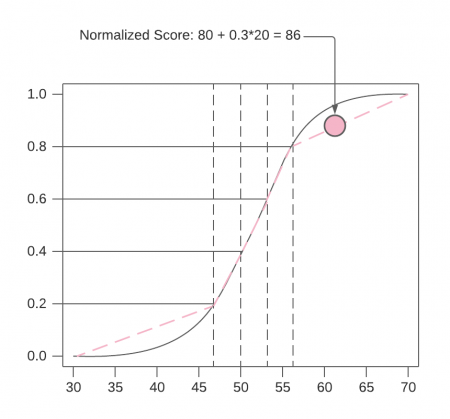
Normalized risk scores get calculated by linearly rescaling between the quantile cutoff points. For example, take a risk score that is in the 80-100% quantile. On the linear scale within that quantile, the score is about one-third of the way along the line. Use 0.3 as the probability for this score. To get the normalized score, the probability (0.3) gets multiplied by the width of the quantile (20), then added to the low end of the quantile range (80):
80 + 0.3*20 = 86
After a normalized risk score gets derived, the entity gets assigned a risk severity level based on the following predetermined values:
- Critical: risk score of 91 - 100
- High: risk score of 61 - 90
- Medium: risk score of 31 - 60
- Low: risk score of 0 - 30
Understanding the risk score for the last 24 hours
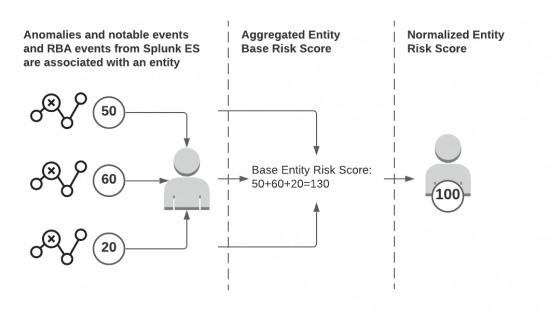
If you select 24 Hours in the Behavioral Analytics service web interface, you see the entity risk scores based on associated anomalies and events from Splunk Enterprise Security detected in the last 24 hours rolling window. The following image summarizes how entity scores get calculated for the last 24 hours:
- Individual anomalies have an initial score based on its severity:
- Low: 30
- Medium: 50
- High: 80
- Anomalies and notable events and RBA events from Splunk Enterprise Security get associated with an entity.
- The anomaly scores get aggregated and represent the base score for the entity, which is then normalized to a score between 0 and 100. A score of 100 gets assigned to the entity with the highest score, and the scores of the remaining entities depend on a percentage of the highest score.
Understanding the risk score for the last 7 days
If you select 7 Days in the behavioral analytics service web interface, you see the entity risk scores based on associated anomalies detected over the past 7 days. Anomalies older than 7 days are not considered in any entity scores.
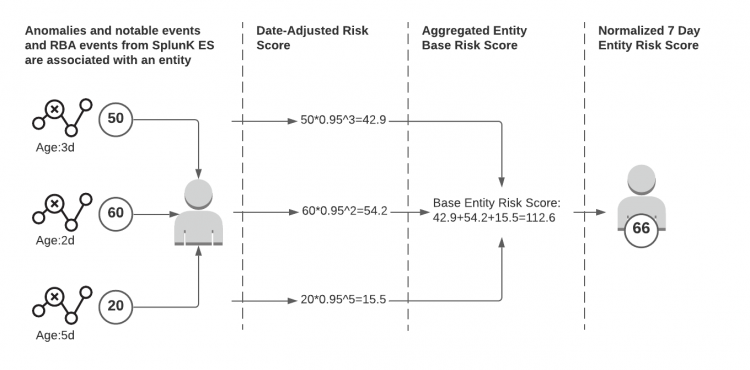
The following image summarizes how entity scores get calculated for the past 7 days:
- Individual anomalies get an initial score based on its severity:
- Low: 30
- Medium: 50
- High: 80
- Anomalies, notables, and risk events from Splunk Enterprise Security get associated with an entity.
- Anomaly scores age over time using the following formula:
score * 0.95 ^ number_of_days
For example, a medium severity anomaly with a base score of 50 that is 3 days old gets a score of 43:
50 * 0.95 ^ 3 = 42.87
- The aged anomaly scores gets aggregated and represent the base score for the entity, which is then normalized to a score between 0 and 100. A score of 100 gets assigned to the entity with the highest score, and the scores of the remaining entities depend on a percentage of the highest score.
See also
For more information on using behavioral analytics service in Splunk Enterprise Security, see the product documentation.
Use behavioral analytics service with Splunk Enterprise Security 7.1.0 or higher
Enable behavioral analytics service on Splunk Enterprise Security
Integrate risk analysis between Splunk Enterprise Security and behavioral analytics service
Creating risk notables using the behavioral analytics service
| Creating risk notables using the behavioral analytics service | Troubleshoot upgrade issues with risk factors |
 Download manual
Feedback submitted, thanks!