The documentation for Splunk Enterprise Security versions 8.0 and higher have been rearchitected from previous versions, causing some links to have redirect errors. To resolve redirect errors, you must use the version selector on the ES documentation homepage to navigate between the versions.
This documentation does not apply to the most recent version of Splunk® Enterprise Security.
For documentation on the most recent version, go to the latest release.
Investigate risk notables that represent a threat
This is the last step in the Reduce alert volumes by triaging notables scenario.
Ram investigates the risk notables that get tagged as True Positive - Suspicious Activity using the timeline visualization on the Incident Review page and identifies the source of the security threat.
- From the Splunk Enterprise Security menu bar, Ram clicks the Incident Review page.
- From the Type list, Ram selects Risk Notable to display the notables that have associated risk events.
- Ram focuses only on the risk notables that have the Disposition tagged as True Positive - Suspicious Activity.
- Ram reviews the following two fields for the risk notables: Risk Events and Aggregated Score. The Aggregated Score is the sum of all the scores associated with each of the contributing risk events.
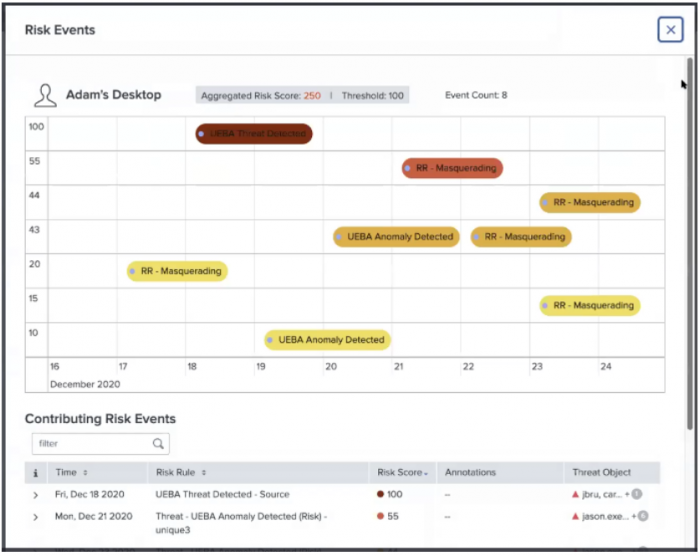
- Ram selects the value in the Risk Events field for the notable event that Ram wants to investigate. This opens a window that contains two panels. The top panel displays a timeline visualization of the contributing risk events that created the notable. The bottom panel includes a table with detailed information on the contributing risk events as shown in the following image:
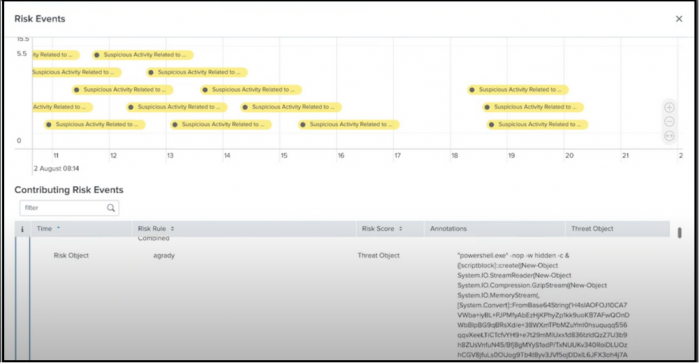
- Ram expands the risk notable in the Contributing Risk Events table for more details to further analyze the risk objects in the security environment.
This includes information on the following fields:- Risk Object
- Source
- Risk Score
- Risk Message
- Saved Search Description
- Threat Object
- Threat Object Type
- Ram correlates the risk events with dates and the severity of the risk scores in the timeline visualization to identify threats.
- Ram also zooms in and out to narrow down the time of occurrence since the timeline visualization plots the contributing risk events using time on the x-axis and the risk score on the y-axis. The timeline visualization also uses color codes on the icons that indicate the severity of the risk scores. Color coding risk score icons are consistent across the Contributing Risk Events table and the timeline visualization of the risk events. Ram knows that a lower risk score corresponds to a lighter color icon.
- Ram now identifies the risk object type through the icons displayed in the header of the timeline visualization.
The icons include:
- User
- System
- Network Artifacts
- Other


Ram can now quickly identify the risk events that might be a threat to the SOC of Buttercup Games.
See also
For more information on investigating risk notables, see the product documentation:
Review risk notables to identify risk in Splunk Enterprise Security
Last modified on 02 June, 2023
| Sort notables by disposition | Isolate user behaviors that pose threats with risk-based alerting |
This documentation applies to the following versions of Splunk® Enterprise Security: 7.3.2, 7.3.3
Feedback submitted, thanks!