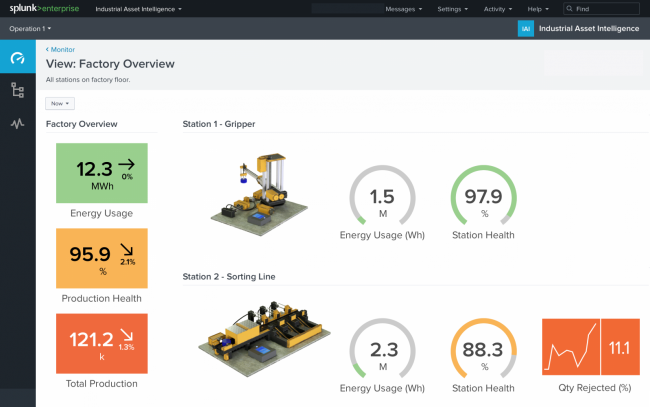
Monitor asset health with Splunk IAI
In Splunk IAI, you can monitor the health of your industrial assets using customized views created by your IAI admin.
Monitor views show real-time data generated by your metrics and other data sources.
Your Splunk IAI administrator creates and customizes monitor views to meet whatever needs you have for your daily work. For example, your admin might create the following views:
- A real-time snapshot of industrial asset health and performance alongside related data that shows how your overall operational efficiency affects your uptime, maintenance schedule, shift changes, and so on.
- A summary view of all critical metrics for an asset that you use to identify anomalies and drill down for further analysis.
- A visualization that shows how a set of metrics are interrelated, overlaid onto a meaningful custom image that provides context for your data.
- A display that shows your metrics data alongside external data, such as weather or financial data.
- A view for a group of assets that provides an asset menu on the view, so you can toggle between the assets in the group to view their metrics.
If you need a customized monitor view, work with your Splunk IAI administrator. For more information about how Splunk IAI administrators create monitor views, see Create views to monitor metrics in Splunk IAI.
Access monitor views
To access all monitor views in an operation, click the Monitor icon in the left sidebar.
You can also access a monitor views for a group by browsing to the group and then clicking the name of the group monitor view.
Use monitor views
You can take the following actions on monitor views:
- Change the time window to an earlier time to look at previous data.
- On a monitor view for a group of assets, use the Select Asset drop-down menu to change the metric data display to a different asset in that group. The selection in this menu applies only to group metrics. If you see a message that states "This metric is not available for the selected asset.", the asset you selected in the "Select Asset" menu doesn't have that metric.
- Depending on how your Splunk IAI administrator configured your monitor views, clicking on a metric can direct you to a Splunk search, a dashboard, an external site, or to the Analyze page where you can analyze the metric to identify and respond to an anomaly in the data. For more information on what you can do on the Analyze page, see Analyze asset metrics in Splunk IAI.
Your Splunk IAI administrator can set alerts so that you receive SMS or email messages based on metric thresholds. When you receive these alerts, use the relevant monitor views to see that metric in context and drill down further to investigate.
| Support and resources for Splunk IAI users | Browse assets, groups, and metrics in Splunk IAI |
This documentation applies to the following versions of Splunk® Industrial Asset Intelligence (Legacy): 1.1.0, 1.1.1, 1.2.1, 1.2.2, 1.3.0

 Download manual
Feedback submitted, thanks!