Customize Episode Review in ITSI
You can customize different properties of a saved Episode Review dashboard to better suit your organization's needs and accelerate triage and investigation. Use the View Settings to customize the look and feel of Episode Review, set the refresh rate, add or remove columns, or configure other default settings.
Prerequisites
By default, read and write permissions are granted to all roles for a newly created view of Episode Review. To restrict permissions, see Modify analyst permissions within Episode Review in ITSI.
Change the viewing mode
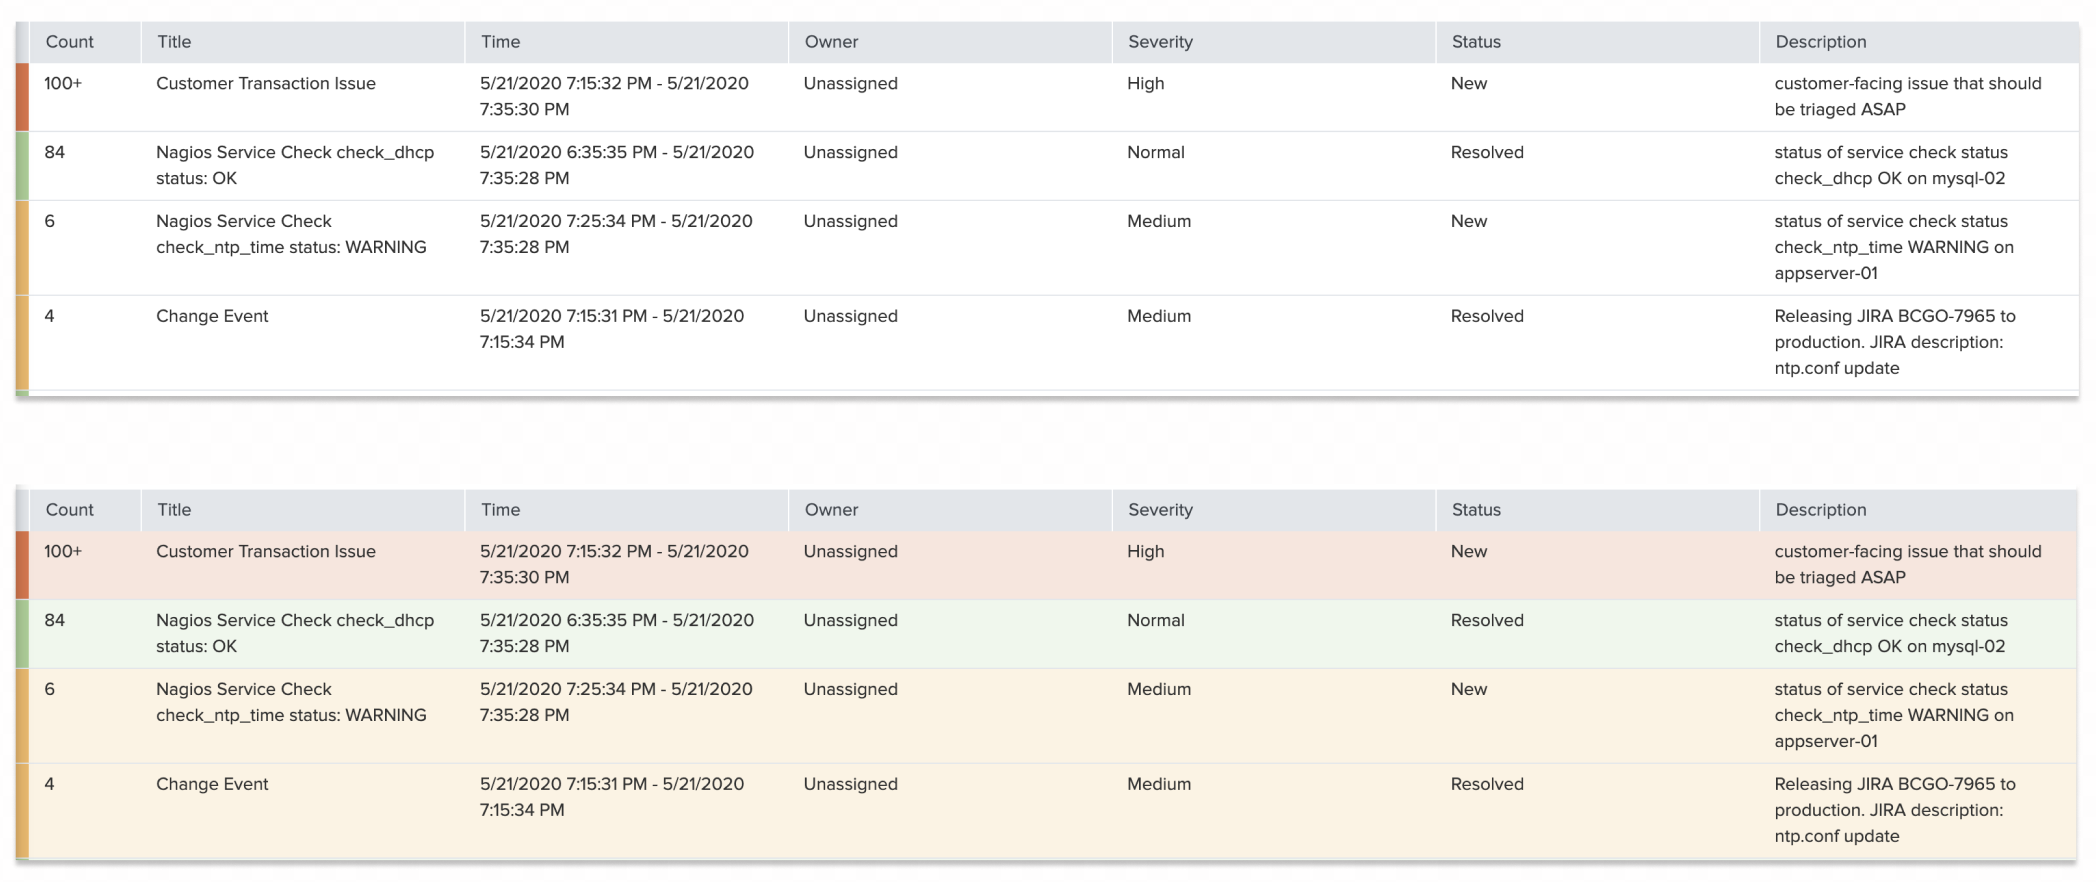
By default, each Episode Review dashboard is in Standard mode, which means the severity color is only displayed to the left of the episode row. You can change the viewing mode to Prominent to fill the entire row with the severity color.
To change the viewing mode, click the gear icon ![]() and change Viewing Option to Standard or Prominent.
and change Viewing Option to Standard or Prominent.
The following image shows the difference between Standard and Prominent modes:
Turn episode view on or off
By default, Episode Review displays episodes rather than notable events. Depending on what kind of issues your organization deals with, you might want to view individual notable events rather than episodes.
To change the episode view, click the gear icon ![]() and turn Episode View on or off.
and turn Episode View on or off.
Change the episode view default tab
By default, when you select an episode, the Impact tab is displayed in the details panel. Depending on the types of issues you're investigating, you might want to display a more relevant tab, such as the Events Timeline or Common Fields. You can modify the default tab that's selected on a per-dashboard basis. In other words, all episodes within that Episode Review saved view will have the same tab selected by default.
To change the default tab, click the gear icon ![]() and use the Episode View Default Tab dropdown to select the tab.
and use the Episode View Default Tab dropdown to select the tab.
After making the change, click through several episodes to make sure the default tab changed.
Set the auto refresh period
The auto refresh rate determines how often Episode Review is refreshed to display new episodes and events. By default the refresh period is set to Off, which means it never automatically refreshes and you need to refresh your browser to update the dashboard. You can change the refresh period to 1 minute, 5 minutes, 30 minutes, 60 minutes, or 24 hours.
To change the refresh rate, click the gear icon ![]() and use the Auto Refresh Period dropdown to select a time.
and use the Auto Refresh Period dropdown to select a time.
Add and remove columns
Each row in Episode Review displays a default set of columns: Title, Time, Owner, Severity, Status, and Description. You can add, remove, or rearrange columns based on which fields are important to your investigation. For example, you might add an All Tickets column to display any ticket linked to each episode.
To edit the columns for a specific view, click the gear icon ![]() and use the Columns Shown section to add, remove, or rearrange columns.
and use the Columns Shown section to add, remove, or rearrange columns.
Specify the Episode Review time format
You can specify the time format for time-related columns such as Time, First Event Time, and Last Event Time. Choose from one of the default time formats or define a custom time string. The time format applies to specific Episode Review saved views.
For a full reference of variables you can use to define time formats, see Date and time format variables in the Search Reference manual. The time format you choose applies to any places in Episode Review where a timestamp is displayed, such as comment time, similar episodes time, and activity time.
| Take action on an episode in ITSI | Modify analyst permissions within Episode Review in ITSI |
This documentation applies to the following versions of Splunk® IT Service Intelligence: 4.11.0, 4.11.1, 4.11.2, 4.11.3, 4.11.4, 4.11.5, 4.11.6, 4.12.0 Cloud only, 4.12.1 Cloud only, 4.12.2 Cloud only, 4.13.0, 4.13.1, 4.13.2, 4.13.3, 4.14.0 Cloud only, 4.14.1 Cloud only, 4.14.2 Cloud only, 4.15.0, 4.15.1, 4.15.2, 4.15.3, 4.16.0 Cloud only, 4.17.0, 4.17.1, 4.18.0, 4.18.1, 4.19.0, 4.19.1, 4.19.2, 4.19.3, 4.19.4, 4.20.0, 4.20.1

 Download manual
Feedback submitted, thanks!