Event Analytics Audit dashboard
The Event Analytics Audit dashboard is designed to provide high-level insight into the notable events coming into your ITSI deployment. This dashboard shows a count of events over the time range you select, along with alert trends, acknowledgements and resolution statistics, and real-time event information and updates.
Dashboard panels
| Panel | Description |
|---|---|
| Episode Ownership and Status by User | The number of episodes that were resolved and acknowledged by each user within the selected time range. |
| Episodes Acknowledged | A raw count of episodes that were acknowledged within the last hour. |
| Mean Time to Acknowledge Episodes | The average amount of time between when an episode appears in Episode Review and when it is acknowledged by a user. Calculated over the last 24 hours. |
| Maximum Time to Acknowledge Episodes | The longest time it took to acknowledge an episode in Episode Review. Calculated over the last 24 hours. |
| Mean Time To Resolve Episodes | The average amount of time between when an episode appears in Episode Review and when it is resolved by a user. Calculated over the last 24 hours. |
| Raw Event Count | The number of events that ITSI ingests into the itsi_tracked_alerts index over the selected time range.
|
| Episodes | The number of episodes created in Episode Review during the selected time range. |
| Noise Reduction | The percentage of noise reduction produced by event grouping. |
| Episodes Linked to Tickets | The number of episodes linked to external tickets during the selected time range. |
| Episodes by Severity | A count of episodes according to severity level. |
| Top 5 Longest Time To Acknowledge Episodes | The five episodes that took the longest time to acknowledge. |
| Top 5 Longest Time To Resolve Episodes | The five episodes that took the longest time to resolve. |
| Top Five Noisiest Hosts | A line graph showing the five hosts producing the most notable events within the selected time range. |
| Total Alerts | A line graph showing the total number of notable events over a given time period. |
| Service Health Scores Correlated to Critical/High Episodes | Service health scores correlated to the number of episodes over a given time period. |
Configure the Event Analytics Audit dashboard
You need to configure the threshold values of the following panels in the Event Analytics Audit dashboard based on your specific ITSI deployment:
- Episodes
- Noise Reduction
- Episodes Linked to Tickets
- Episodes Acknowledged
The colors corresponding to the values in each panel will differ based on the number of notable events being indexed on your deployment. You can manually edit the dashboard to configure these threshold values.
- Click Edit.
- Click Format Visualization in one of the panels listed above.
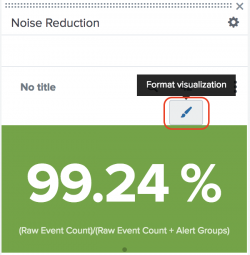
- Select Color in the side bar.
- Adjust the ranges (in minutes) for each severity color.
- Repeat steps 2-4 for the other panels listed above.
- Click Save.

| Configure the Rules Engine to handle indexer cluster rolling restarts and upgrades | Event Analytics Monitoring dashboard |
This documentation applies to the following versions of Splunk® IT Service Intelligence: 4.11.0, 4.11.1, 4.11.2, 4.11.3, 4.11.4, 4.11.5, 4.11.6, 4.12.0 Cloud only, 4.12.1 Cloud only, 4.12.2 Cloud only, 4.13.0, 4.13.1, 4.13.2, 4.13.3, 4.14.0 Cloud only, 4.14.1 Cloud only, 4.14.2 Cloud only, 4.15.0, 4.15.1, 4.15.2, 4.15.3, 4.16.0 Cloud only, 4.17.0, 4.17.1, 4.18.0, 4.18.1
Feedback submitted, thanks!