Use the ITSI Configuration Assistant
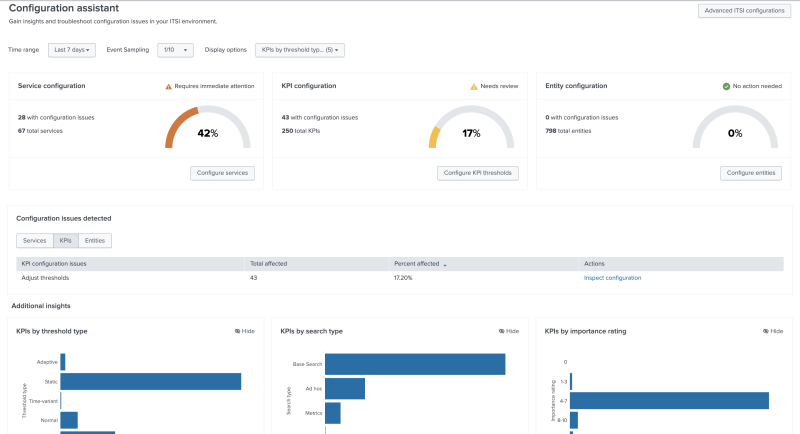
Use the Configuration Assistant to monitor and optimize the health of your ITSI environment at scale. The dashboard helps you identify configuration issues for your services, KPIs, and entities at a glance, resolve these issues, and apply changes to your objects in bulk. Access the Configuration Assistant from the Configuration option in the navigation menu.
Dashboard Panels
| Panel | Description |
|---|---|
| Service configuration | Highlights the percentage of services in your environment with configuration issues (coming soon). Select Configure services to manually update the services identified. |
| KPI configuration | Highlights the percentage of KPIs in your environment with configuration issues, such as inaccurate threshold or time policy configurations. Select Configure KPI thresholds to manually update the KPIs identified. Alternatively, run AI analysis to receive recommended threshold recommendations. For more information, see the Inspect KPI configuration issues section below. |
| Entity configuration | Highlights the percentage of entities in your environment with configuration issues, such as an unstable entity status. Select Configure entities to manually update the entities identified. |
| Configuration issues detected | View specific details of the configuration issues affecting your ITSI objects. Select Inspect to redirect to the specific configuration pages for each object. |
Filters and additional insights
You can filter for specific issues using the following options on the dashboard:
- Time range: find issues that occurred within a specific period of time.
- Event Sampling: retrieve a sample set of events, instead of the entire event set, to quickly query your data.
- Display options: adjust the content displayed in the Additional insights section of the page. The Additional insights section includes the following information:
- KPIs by threshold type: lists the number of KPIs with a specific threshold setting: static, time-variant, adaptive, or info. Static and time-variant thresholds are set based on the KPI's behavior at specific times of the day or week, and do not change after you configure them. Adaptive thresholds generate thresholds dynamically and are updated daily based on changes in your KPI data.
- KPIs by search type: lists KPIs by their source search type: data model, ad hoc search, metrics search, or base search. For more information, see Define a KPI source search in ITSI.
- KPIs by importance rating: lists KPIs by the level of impact that the KPIs have on the overall service health score. KPIs with higher importance ratings have a larger effect on the service health score. For more information, see Set KPI importance values in ITSI.
- KPI count per service: lists the number of KPIs associated with a particular service.
- Most used KPI threshold templates: For more information, see Available KPI threshold templates.
Inspect KPI configuration issues
Poorly configured KPI thresholds can contribute to inaccurate service health scores or other anomalous behavior.
- In the Configuration issues detected section, select KPIs to view descriptions of configuration issues identified for the KPIs in your environment.
- Select Inspect. A side panel displays KPIs with configuration issues that require immediate attention.
- (Optional) Select See all details to view and manually configure the KPIs with configuration issues. Alternatively, configure KPIs with Splunk AI to automatically generate optimal time-policies and threshold levels for your data.
- Select up to 10 KPIs from the list to automatically configure with Splunk AI analysis.
- After selecting the KPIs, select Run AI analysis to open a new page that provides recommended configurations based on AI analysis of your KPI's behavior.
- Recommendations are provided for each individual KPI that you selected. Review or make adjustments to the the Splunk AI recommendations on the page:
Title Description Splunk AI recommendations List of recommendations generated by Splunk AI and tailored to your KPI's data. Recommendations include the recommended adaptive thresholding algorithm to apply to your KPI, outlier exclusion setting, time policy settings, and more. KPI severity comparison Compare the results of manually configured threshold settings against the settings generated by Splunk AI. The AI-generated settings are optimized to fit your KPI's behavior over time. Preview threshold levels Visualize your KPI performance over time with the new thresholds applied. Select Edit to manually adjust the specific severity-level thresholds to better fit expected behavior. For example, if you know that the thresholds levels for your Page visits KPI should be normal on Mondays due to lower website traffic, you can adjust the recommended thresholds to reflect this. - Select Accept or Reject for the recommended threshold configurations for each KPI, or select Skip to move on to the next KPI in the list.
Inspect entity configuration issues
Entities may no longer be sending data due to incorrect discovery search configurations, duplicate aliases, or issues with specific entity fields.
- In the Configuration issues detected section, select Entities to view descriptions of configuration issues identified for the entities in your environment.
- Select Inspect. A side panel displays the entities that require immediate attention, or takes you to a separate configuration page with further steps to remediate the configuration issue. Entities that require immediate attention may create false alerts or contribute to inaccurate service health scores.
- Select a specific entity to view additional details and specific troubleshooting steps to fix the issues identified. For more information about entity status, see Understand entity status and search data in ITSI.
Advanced ITSI configurations
Select the Advanced ITSI configurations button to set up global settings for your environment, such as setting the refresh rate for the Service Analyzer and bulk update time policies for your KPIs. You must have the admin role to make these changes. For more information, see Use the ITSI Advanced Configuration page.
| Use the ITSI Upgrade Readiness Dashboard | Use the ITSI Advanced Configuration page |
This documentation applies to the following versions of Splunk® IT Service Intelligence: 4.19.0, 4.19.1, 4.19.2, 4.20.0, 4.20.1

 Download manual
Feedback submitted, thanks!