Use the ITSI SVC Statistics dashboard
The ITSI SVC Statistics dashboard enables you to view the total Splunk Virtual Core (SVC) usage for ITSI. An SVC is a unit of capabilities in Splunk Cloud Platform that includes compute, memory, and I/O resources. To learn more about SVCs, see Monitor current SVC usage of your workload-based subscription in the Splunk Cloud Platform Admin manual.
The dashboard can be used as a reference to view the SVC breakdown for your ITSI instance by service tags. Clone and configure this dashboard to generate other breakdowns based on your organization's specific requirements.
In release 4.19.0, this dashboard was updated to comply with the latest Splunk dashboard standards, resulting in minor visual changes. The older version of this dashboard changes the chart color from the default purple to teal green when all searches complete, but the newer version of the dashboard retains the default purple color.
Dashboard panels
| Panel | Description |
|---|---|
| ITSI SVC Entitlement | Displays the number of SVCs assigned to your subscription per your license entitlement that are specific to ITSI. To display the ITSI SVC entitlement, duplicate the dashboard and edit the following search string in Source mode:
Replace |
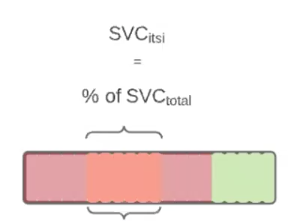
| ITSI SVC Usage In Last 7 Days | The ITSI SVC is calculated as a portion of the total SVC entitlements. The percentage is calculated by dividing the number of scheduled ITSI searches by the total number of searches.
The diagram below shows a visual representation of the breakdown calculation: |
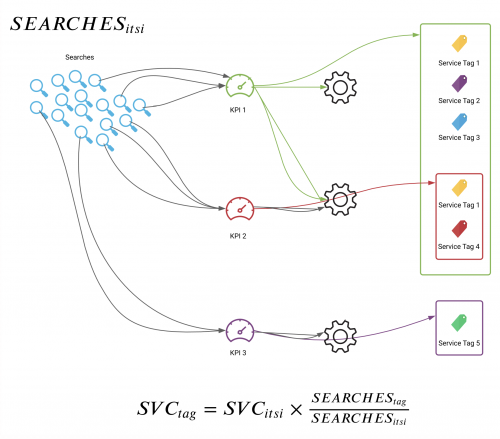
| ITSI SVC Usage Breakdown by Service Tags In Last 24 Hours | Displays a breakdown of SVC usage in the last 24 hours based on service tags. The breakdown is calculated by dividing the number of searches for a KPI by relevant service tags. Each KPI base search is linked to one or more services. For KPIs that share a service, the searches are divided by all tags on associated services. The GLOBAL service tag represents KPI searches that are not tagged. For more information about service tags, see Add tags to a service in ITSI.
The diagram below shows a visual representation of the breakdown calculation: |
| ITSI Search Breakdown By Service Tags In Last 7 Days | Displays a breakdown of the number of ITSI searches in the last 7 days based on service tags. The breakdown is calculated by dividing the number of searches for a KPI by relevant service tags. Each KPI base search is linked to one or more services. For KPIs that share a service, the searches are divided by all tags on associated services. |
| ITSI SVC Breakdown By Service Tags In Last 7 Days |
Displays a breakdown of SVC counts in the last 7 days based on service tags. The breakdown is calculated by dividing the number of searches for a KPI by relevant service tags. |
| Use the ITSI Health Check dashboard | Use the ITSI Upgrade Readiness Dashboard |
This documentation applies to the following versions of Splunk® IT Service Intelligence: 4.19.0, 4.19.1, 4.19.2, 4.19.3, 4.19.4, 4.20.0, 4.20.1


 Download manual
Feedback submitted, thanks!