Configure the KPI aggregation metric in a deep dive in ITSI
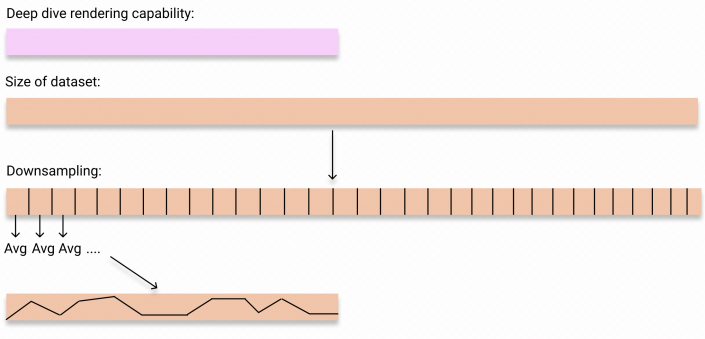
The KPI aggregation metric in an ITSI deep dive is the statistical operation performed on multiple KPI data points to appropriately downsize your data and plot it in a swimlane. This downsizing process is necessary because if the time range of your deep dive is large, ITSI can't render all the data points. Therefore, it uses the timechart command as an aggregator. It performs a process called "downsampling" to reduce the size of your data so it can be plotted in the deep dive.
For example, you have a 15-minute KPI over a 24-hour period, giving you 96 total data points. But if the deep dive is only capable of rendering 50 data points, is must reduce the size of that data from 96 to 50. ITSI distributes the 96 data points into 50 distinct buckets, then it uses the selected KPI Aggregation Metric (average, median, maximum, or minimum) to perform a statistical operation on each bucket. It uses the output of that statistical operation as the single data point to plot in the deep dive for each time bucket.
The KPI aggregation metric affects the aggregated KPI values across time as well as individual entity values if the KPI is split by entity. By default, ITSI takes an average of the KPI and entity data. You can switch the KPI aggregation metric between average, median, maximum, and minimum. Note that the aggregation metric you choose is not in any way extracted from the way the KPI is configured.
Changing the KPI aggregation metric can help you better visualize search results aggregated over the selected time range. It can also help you troubleshoot issues if the current metric display isn't useful. Switching the aggregation metric has no impact on the underlying KPI configuration.
Here's an example of how ITSI uses the KPI aggregation to plot a KPI data points.
KPI Aggregation Metric = Average
`get_itsi_summary_index` `service_level_kpi_only` `get_only_itsi_summary_kpi(66ec11b1f86a3a40f20253b9)` | timechart limit=0 useother=0 avg(alert_value) by kpiid
KPI Aggregation Metric = Max
`get_itsi_summary_index` `service_level_kpi_only` `get_only_itsi_summary_kpi(66ec11b1f86a3a40f20253b9)` | timechart limit=0 useother=0 max(alert_value) by kpiid
Notice the only thing that changes is the operation taken on the alert_value - average or max. Each alert_value for a KPI is the actual aggregated numeric value of the KPI for this data point.
| Configure deep dive lanes in ITSI | Compare search results from different time ranges in an ITSI deep dive |
This documentation applies to the following versions of Splunk® IT Service Intelligence: 4.11.0, 4.11.1, 4.11.2, 4.11.3, 4.11.4, 4.11.5, 4.11.6, 4.12.0 Cloud only, 4.12.1 Cloud only, 4.12.2 Cloud only, 4.13.0, 4.13.1, 4.13.2, 4.13.3, 4.14.0 Cloud only, 4.14.1 Cloud only, 4.14.2 Cloud only, 4.15.0, 4.15.1, 4.15.2, 4.15.3, 4.16.0 Cloud only, 4.17.0, 4.17.1, 4.18.0, 4.18.1, 4.19.0, 4.19.1, 4.19.2, 4.19.3, 4.19.4, 4.20.0, 4.20.1

 Download manual
Feedback submitted, thanks!