Insights
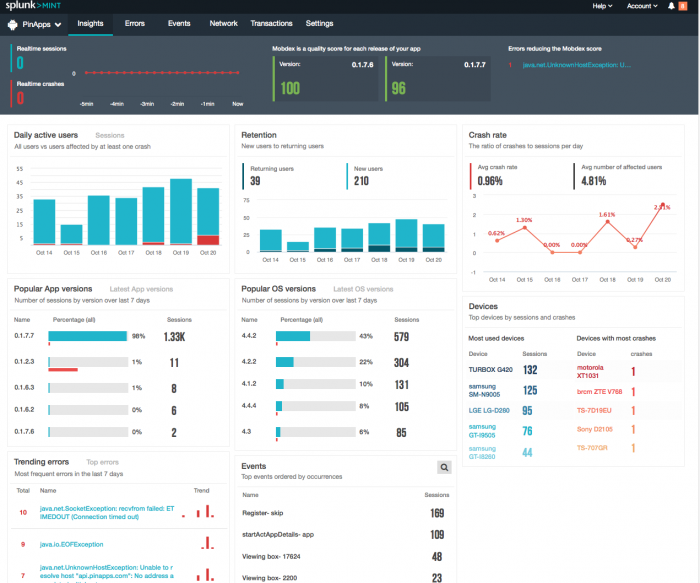
The Insights dashboard provides an immediate overview of your app, from real-time sessions and crashes to app usage.
The Insights dashboard displays your Mobdex score for the current version of the app and the previous version, so you can know with one glance if you have improved app quality or introduced new issues that require attention. The Mobdex algorithm uses information about your app's users, the rate of occurrence, and severity of errors to calculate the score. The higher the score, the healthier your app.
The charts on this dashboard show a summary of activity over the last seven days:
- Unique users/Sessions: Find out how many active daily users you have, along with how many of them experienced a crash. You can also see how many unique sessions there were, and the number of individual sessions that experienced a crash.
- Retention: Compare the number of returning users to new users.
- Crash rate: See the percentage of crashes to sessions.
- Popular app version/Latest app versions: See a breakdown of the app usage by different versions, sorted by popularity or version number.
- Popular OS version/Latest OS versions: See a breakdown of the app usage on different OS versions, sorted by popularity or version number.
- Events: See which events are occuring the most.
- Trending errors/Top errors: See which errors are occurring more frequently (trending), or which errors have occurred the most.
| Create a new project | Error reporting |
This documentation applies to the following versions of Splunk MINT™ Management Console (EOL): 1.0

 Download manual
Feedback submitted, thanks!