Transaction monitoring
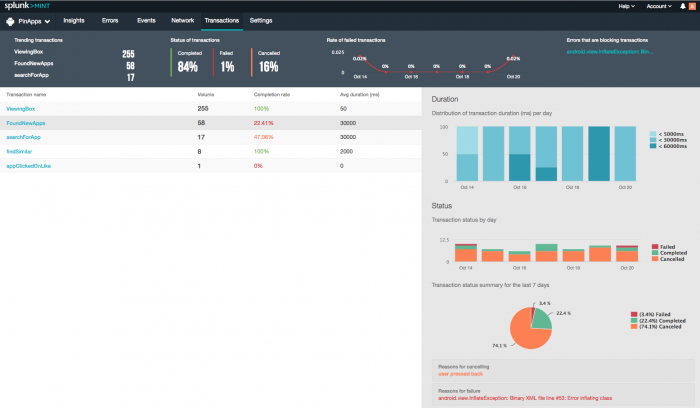
The Transactions dashboard tracks the duration, completion time, and failure rate of custom-defined transactions. Get better visibility into where transaction bottlenecks reside and which transactions users perform most often.
The Transaction dashboard shows a summary of transaction activity over the last seven days. You can quickly see which transactions are gaining frequency, see a breakdown by transaction status, the rate of failed transactions, and see which errors are affecting transactions the most.
The table on this page shows the transactions that have occurred over the last seven days. Click a transaction to see details about it:
- The breakdown of transactions per day, where each bar section corresponds to a bucketed time duration in milliseconds.
- The volume of transactions, each day and overall, by status.
- The top reasons for cancelled transactions.
Add transactions to your mobile apps
To add transactions to your mobile apps, see the following topics in the Splunk MINT SDK Developer Guides:
| Network monitoring | Project settings |
This documentation applies to the following versions of Splunk MINT™ Management Console (EOL): 1.0

 Download manual
Feedback submitted, thanks!