Cluster Numeric Events
The Cluster Numeric Events assistant partitions events with multiple numeric fields into groups of events based on the values of those fields.
The groupings aren't known in advance, therefore, the learning is unsupervised.
Algorithms
The Cluster Numeric Events assistant uses the following algorithms:
Workflow
- Create a new Cluster Numeric Events Experiment, including the provision of a name.
- On the resulting page, run a search.
- (Optional) Add preprocessing steps via the +Add a step button.
- Select the algorithm to use for clustering from the Algorithm drop down menu.
- Specify the fields to use for clustering.
- For K-means, Birch, and Spectral Clustering, specify the number of clusters to use. For DBSCAN, specify a value between 0 and 1 for eps (the size of the neighborhood).
- Click Cluster. View any changes to this cluster under the Experiment History tab.
You will see a raw data preview on the bottom panel of the screen.
See Preprocessing for information.
If your data has been preprocessed, you should choose from the preprocessed fields.
Smaller numbers result in more clusters.
Important note: The experiment will now be saved as a Draft only. In order to update alerts or reports, click the Save button in the top right of the page.
Interpret and validate
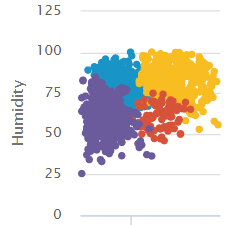
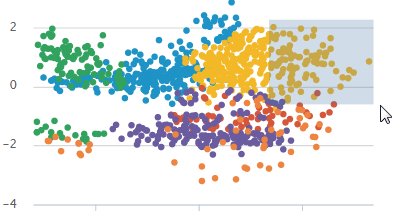
After the numeric events are clustered, review the cluster visualization. The fields included in the visualization are listed. You can add and remove fields, and then click Visualize to change the visualization.
You can drag a selection rectangle around some of the points in a plot to see the corresponding points on the other plots.
The visualization displays a maximum of 1000 points, 20 series and 6 fields (1 label and 5 variables).
Deploy clustering
After you interpret and validate the clustering, deploy it:
- Click the Save button in the top right corner of the page. You can edit the title and add or edit and associated description. Click Save when ready.
- Click Open in Search to open a new Search tab. This tab will be filled out with the search query that was used to fit the model.
- Click Show SPL to see the search query that was used for the clustering with comments that contain explanations.
- Under the Experiments tab, you can see experiments grouped by assistant analytic. Under the Manage menu, choose to:
- Create Alert (barring use of DBSCAN or Spectral Clustering Algorithms)
- Edit Title and Description
- Schedule Training
- Click Create Alert to set up an alert that is triggered when the number of events in the cluster meets a threshold you specify. Once at least one alert is present, the bell icon will be highlighted in blue.
Note than if you have chosen DBSCAN or Spectral Clustering as the algorithm, you can save the Experiment, but not the model.
For example, you could use this same query on a different data set.
If you make changes to the saved experiment you may impact affiliated alerts. Re-validate your alerts once experiment changes are complete.
For more information about alerts, see Getting started with alerts in the Splunk Enterprise Alerting Manual.
| Forecast Time Series | Preprocessing |
This documentation applies to the following versions of Splunk® Machine Learning Toolkit: 3.2.0, 3.3.0


 Download manual
Feedback submitted, thanks!