Predict Categorical Fields
The Predict Categorical Fields assistant displays a type of learning known as classification. A classification algorithm learns the tendency for data to belong to one category or another based on related data.
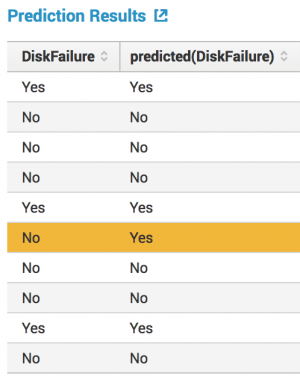
The classification table below shows the actual state of the field versus predicted state of the field. The yellow bar highlights an incorrect prediction.
Algorithms
The Predict categorical Fields assistant uses the following classification algorithms:
Fit a model to predict a categorical field
Prerequisites
- For information about preprocessing, see Preprocessing in the Splunk Machine Learning ML-SPL API Guide.
- If you are not sure which algorithm to choose, start with the default algorithm, Logistic Regression, or see Algorithms.
Workflow
- Create a new Predict Categorical Fields Experiment, including the provision of a name.
- On the resulting page, run a search.
- (Optional) Add preprocessing steps via the +Add a step button.
- Select an algorithm from the Algorithm drop down menu.
- Select the categorical field from the drop down menu you want to predict.
- Select a combination of fields you want to use to predict the categorical field.
- Split the data into training and testing data
- (Optional) Depending on the algorithm you selected, the toolkit may show additional fields to include in your model.
- (Optional) Add information to the Notes field to keep track of adjustments you make as you adjust and fit the algorithm to your data.
- Click Fit Model. View any changes to this model under the Experiment History tab.
This list of fields is populated by the search you just ran.
This list contains all of the fields from your search except for the field you selected to predict.
Fit the model with the training data, and then compare your results against the testing data to validate the fit. The default split is 50/50, and the data is divided randomly into two groups.
To get information about a field, hover over it to see a tooltip.
Important note: The model will now be saved as a Draft only. In order to update alerts or reports, click the Save button in the top right of the page.
Interpret and validate
After you fit the model, review the results and visualizations to see how well the model predicted the categorical field. In this analysis, metrics are related to misclassifying the field, and are based on false positives and negatives, and true positives and negatives.
| Result | Application |
|---|---|
| Precision | This statistic is the percentage of the time a predicted class is the correct class. |
| Recall | This statistic is the percentage of time that the correct class is predicted. |
| Accuracy | This statistic is the overall percentage of correct predictions. |
| F1 | This statistic is the the weighted average of precision and recall, based on a scale from zero to one. The closer the statistic is to one, the better the fit of the model. |
| Classification Results (Confusion Matrix) | This table charts the number of actual results against predicted results, also known as a Confusion Matrix. The shaded diagonal numbers should be high (closer to 100%), while the other numbers should be closer to 0. |
Refine the model
After you interpret and validate the model, refine the model by adjusting the fields you used for predicting the categorical field. Click Fit Model to interpret and validate again.
Suggestions on how to refine the model:
- Remove fields that might generate a distraction.
- Add more fields.
In the Experiment History tab, which displays a history of models you have fitted, sort by the statistics to see which combination of fields yielded the best results.
Deploy the model
After you interpret, validate and refine the model, deploy it:
- Click the Save button in the top right corner of the page. You can edit the title and add or edit and associated description. Click Save when ready.
- Click Open in Search to open a new Search tab.
- Click Show SPL to see the search query that was used to fit the model.
- Under the Experiments tab, you can see experiments grouped by assistant analytic. Under the Manage menu, choose to:
- Create Alert
- Edit Title and Description
- Schedule Training
- Click Create Alert to set up an alert that is triggered when the predicted value meets a threshold you specify. Once at least one alert is present, the bell icon will be highlighted in blue.
This shows you the search query that uses all data, not just the training set.
For example, you could use this same query on a different data set.
If you make changes to the saved experiment you may impact affiliated alerts. Re-validate your alerts once experiment changes are complete.
For more information about alerts, see Getting started with alerts in the Splunk Enterprise Alerting Manual.
| Predict Numeric Fields | Detect Numeric Outliers |
This documentation applies to the following versions of Splunk® Machine Learning Toolkit: 3.2.0, 3.3.0

 Download manual
Feedback submitted, thanks!