Deep dive: Using ML to detect outliers in server response time
The goal of this deep dive is to identify periods of time where web applications have unusually slow response times.
Slow website response times can be damaging to customer experience, driving users to other services and potentially damaging your brand.
Data sources
The following data sources are suitable for this deep dive:
- Any
tomcat:access:loglogs
Algorithms
For best results, use the DensityFunction algorithm.
As an alternative approach, try stats or the DBSCAN algorithm.
Train the model
Before you begin training the model, do the following things:
- Change the index, source type, and
response_timemetric type to identify errors for your environment. - You must pick a search window that has enough data to be representative of your environment. Search over 30 days at a minimum for this analytic. The more data the better.
Enter the following search into the search bar of the app you where want the analytic in production:
index=tomcat_logs sourcetype="tomcat:access:log"
| timechart span=5m avg(response_time) as avg_resp_time
| eval HourOfDay=strftime(_time,"%H")
| fit DensityFunction avg_resp_time by HourOfDay as outlier into response_time_outlier_model
This search counts the response time over 5 minute time intervals, enriches the data with the hour of day, and then trains an anomaly detection model to detect unusual response times by the hour of day.
After you run this search and are confident that it is generating results, save it as a report and schedule the report to periodically retrain the model. As a best practice, train the model every week. Schedule training for a time when your Splunk platform instance has low utilization.
Model training with MLTK can use a high volume of resources.
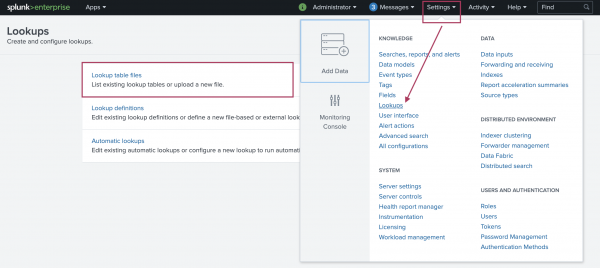
After training the model you can select Settings in the top menu bar, then select Lookups, then select Lookup table files. and search for your trained model.
Make sure that the permissions for the model are correct. By default, models are private to the user who has trained them, but since you have used the app: prefix in your search, the model is visible to all users who have access to the app the model was trained in.
Apply the model
Now that you have set up the model training cycle and have an accessible model, you can start applying the model to data as it is coming into the Splunk platform. Use the following search to apply the model to data:
index=tomcat_logs sourcetype="tomcat:access:log"
| timechart span=5m avg(response_time) as avg_resp_time
| eval HourOfDay=strftime(_time,"%H")
| apply response_time_outlier_model
This search can be used to populate a dashboard panel or can be used to generate an alert.
When looking to flag outliers as alerts, you can append | search outlier=1 to our search, which will filter your results to show only those that have been identified as outliers. This search can then be saved as an alert that triggers when the number of results is greater than 0, which can be run on a scheduled basis such as hourly.
Tune the model
When training and applying your model, you might find that the number of outliers being identified is not proportionate to the data: that the model is either flagging too many or too few outliers. The DensityFunction algorithm has a number of parameters that can be tuned to your data, creating a more manageable set of alerts.
The DensityFunction algorithm has a threshold option that is set at 0.01 by default, which means it will identify the least likely 1% of the data as an outlier. This threshold can be configured as the apply stage, so it can be increased or decreased depending on the tolerance for outliers, as shown in the following search:
index=tomcat_logs sourcetype="tomcat:access:log"
| timechart span=5m avg(response_time) as avg_resp_time
| eval HourOfDay=strftime(_time,"%H")
| apply response_time_outlier_model threshold=0.005
| search outlier=1
Additional fields can also be extracted and used during the fit and apply stages. For example, if your data has hourly and daily variance, such as significantly more errors during working hours on a weekday, you can include the hour of the day and the day of the week in the by clause to more finely tune your model to your data, as shown in the following search:
index=tomcat_logs sourcetype="tomcat:access:log"
| timechart span=5m avg(response_time) as avg_resp_time
| eval HourOfDay=strftime(_time,"%H"), DayOfWeek=strftime(_time,"%a")
| fit DensityFunction avg_resp_time by "HourOfDay,DayOfWeek" into app:response_time_outlier_model
Make sure that all additional fields that are used for training your model are also included in your model apply search.
Learn more
For help using this deep dive, see Troubleshooting the deep dives.
See the following Splunk blog posts on outlier detection:
- Cyclical Statistical Forecasts and Anomalies - Part 1
- Cyclical Statistical Forecasts and Anomalies - Part 4
- Cyclical Statistical Forecasts and Anomalies - Part 5
- Building Machine Learning Models with DensityFunction
- Anomalies Are Like a Gallon of Neapolitan Ice Cream - Part 1
- Anomalies Are Like a Gallon of Neapolitan Ice Cream - Part 2
| Deep dive: Using ML to detect outliers in error message rates | Deep dive: Using ML to identify network traffic anomalies |
This documentation applies to the following versions of Splunk® Machine Learning Toolkit: 4.5.0, 5.0.0, 5.1.0, 5.2.0, 5.2.1, 5.2.2, 5.3.0, 5.3.1, 5.3.3, 5.4.0, 5.4.1, 5.4.2, 5.5.0

 Download manual
Feedback submitted, thanks!