About the Splunk MINT App
The Splunk MINT App gives you the power of Splunk to gain operational intelligence around your mobile environment. The Splunk MINT App aggregates data from the individual mobile app projects you set up in Splunk MINT Management Console, then lets you view data for any combination of mobile apps—for example, all of your apps for a particular platform, or all of your apps that have been released, over any time range. You can correlate Splunk MINT data with other operational intelligence in Splunk for end-to-end transaction analysis.
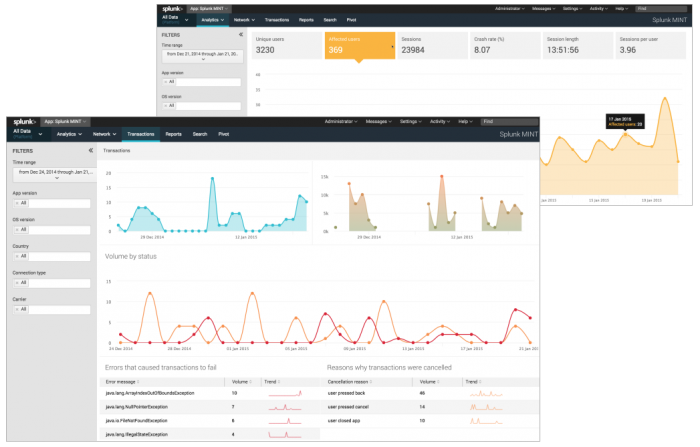
In addition to all of the features you get with Splunk MINT Management Console, the Splunk MINT App provides a data model, set of dashboards, and the ability to search your mobile intelligence information in Splunk Enterprise. You can gather valuable insights and visibility into your mobile apps, including network performance, location, transactions, and usage.
Features
With Splunk MINT you can:
Find the root causes of crashes and poor app performance
- Find out which errors are occurring the most by OS, device, and app version.
- Determine what users were doing when a crash occurred.
- View the stack trace and instance occurrences for specific errors.
- Capture LogCat and NSLog output from your devices.
View network information to analyze your system capacity
- Measure latency, volume, and status codes for all HTTP calls.
- Monitor specific events and transactions.
- Filter information by connection type and carrier.
Follow end-to-end processes in your mobile apps to understand the user experience
- Report custom-defined events in your apps.
- Use transactions to follow specific tasks from start to finish.
- Add breadcrumbs to your crash reports to indicate when specific actions occur.
Get insights about the usage of your mobile apps
- Learn which platforms and devices are being used most.
- Find out how are your apps are performing on each OS and device.
- See how many users are affected by errors.
- Gain insight on usage and performance by users' locations.
- Correlate the performance and usage of your apps across mobile devices, web, and other channels.
How does Splunk MINT work?
Splunk MINT has several components that work together:

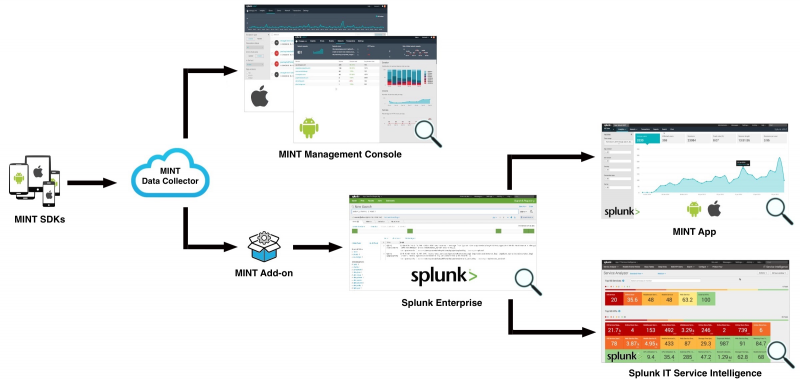
- The MINT SDKs integrate MINT into your mobile apps with only one line of code. The SDKs are available for several platforms.
- The MINT Data Collector forwards data from mobile apps to the MINT Management Console and the MINT Add-on for Splunk Enterprise.
- The cloud-based MINT Management Console shows you seven days of information about crashes, usage, and performance for each individual MINT project (a MINT project corresponds to one mobile app on one platform).
- The MINT Add-on collects data about your mobile app projects from the MINT Data Collector and sends it to Splunk Enterprise.
- The MINT App for Splunk Enterprise provides dashboards, saved reports, and search functionality allowing you to view data for all of your MINT app projects together, over all time, to gain powerful insights about all channels of your organization. For a comparison, see What's the difference between the Splunk MINT Management Console and the Splunk MINT App?
- The End User Experience Monitoring (EUEM) module for Splunk IT Service Intelligence (ITSI) monitors metrics related to the end-user experience and correlates end-user performance issues such as page load time, page rendering time, error rates, and AJAX latency.
How does the Splunk MINT App work?
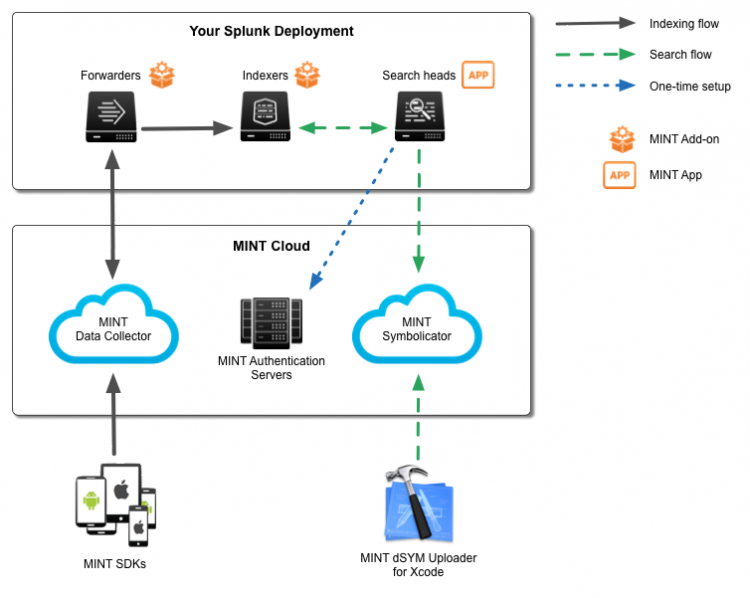
The diagram below shows how data flows into the Splunk MINT App when using the MINT Data Collector to send data from mobile apps:
- Mobile app data: The MINT SDKs send data from mobile devices to the MINT Data Collector. Then, fowarders in your Splunk Enterprise deployment fetch data from the MINT Data Collector.
- Symbolication data (dSYM): When developing mobile apps for iOS, use the MINT dSYM Uploader for Xcode to send symbolication information to the MINT Symbolicator and then to Splunk Enterprise so that iOS errors in Splunk are symbolicated—that is, human readable. For details, see Configure your project for symbolication in the Splunk MINT SDK for iOS Developer Guide.
- App and Add-on: The Splunk MINT App is installed on search heads. The app includes a Splunk MINT Add-on, which is installed on forwarders and indexers. For installation details, see Install and configure the Splunk MINT App.
How do I monitor mobile apps with Splunk MINT?
- Get a Splunk MINT account.
- Get the Splunk MINT SDKs.
- Create projects for your mobile apps in Splunk MINT Management Console.
- Integrate MINT into your mobile apps.
- View data for your mobile apps in MINT Management Console.
- Set up the Splunk MINT Add-on to pull data from the MINT Data Collector.
- View your MINT data in Splunk Enterprise.
- Run searches directly in Splunk Enterprise using the Search & Reporting app.
- Use the Splunk MINT App.
- Use the End User Experience Monitoring (EUEM) module for Splunk IT Service Intelligence (ITSI).
For each platform your app runs on, download the corresponding Splunk MINT SDK or plugin:
Log in to Splunk MINT Management Console and create a project for one variation of your mobile app (a platform and release stage, such as Android/Testing, or iOS/Release). You'll get an API key and a line of code to add for that particular platform—copy it to your clipboard:
Paste the line of code that contains your API key into your mobile app code to integrate MINT:
Repeat steps 3-4 for each of the mobile apps you want to monitor, creating one project for each platform/release stage combination.
When you start using your mobile apps, they will begin to send data to the Splunk MINT Data Collector. Go back to MINT Management Console and open your mobile app projects. You'll start to see data appear in your dashboards in minutes.
On your indexers and forwarders, install the MINT Add-on. On your forwarders, set the MINT Data Collector token.
Once your MINT data is indexed in Splunk Enterprise, you can view your data in different ways:
What are the keys and tokens used by MINT?
The following table summarizes the different keys and tokens used by Splunk MINT.
| Name | What is it? | Where is it? |
|---|---|---|
| API key | Identifies a specific mobile app project and is generated for each new project you create in Splunk MINT Management Console. | On the MINT Management Console home page, one key per project. |
| API token | Identifies your Splunk MINT account, and is used to provide authentication when integrating third-party apps such as HipChat or when using the dSYM uploader script. | In MINT Management Console, under Account > Account Info. |
| MINT Data Collector token | Connects your Splunk MINT account to Splunk Enterprise and enables iOS stack traces to be symbolicated in the MINT App. | In MINT Management Console, under Account > Usage. |
| HEC token | Enables you to use the HTTP Event Collector with MINT. | In Splunk Web, under Settings > Data inputs. |
What's the difference between the Splunk MINT Management Console and the Splunk MINT App?
The following table summarizes the main differences between the Splunk MINT Management Console and the Splunk MINT App.
| Feature | MINT Management Console | Splunk MINT App |
|---|---|---|
| Projects | Projects correspond to individual mobile apps, and are a combination of a unique API key for the project, a package name (such as com.packagename), and platform (iOS or Android). Projects must be created in MINT Management Console before you can view any data for the mobile app in either MINT Management Console or in the Splunk MINT App. | Projects are like filters that let you select the mobile app projects for which you want to view data. For example, you might create a project that displays data only for your iOS mobile apps, or for all versions of one mobile app. You must create mobile app projects in MINT Management Console before you can create MINT App projects to view them. |
| Data display (apps) | Displays data for a single mobile app on one platform. | Displays data for as many of your mobile apps as you want, in combinations you select. |
| Data display (values) | Uses sampled data that affects metrics. | Uses raw, unsampled data, so the data is more precise. |
| Data retention | Displays and retains data for one week (7 days). | Retains data as long as you want. You can view data for the time ranges you specify. |
| Dashboards | Displays specialized dashboards that show you specific areas of information (such as errors and error details, events, and insights). | In addition to general and specialized dashboards, lets you search your data using search queries to customize the data you want to see. For example, you can monitor transactions and the end-to-end process for a particular user to understand your customers' experience using your apps. You can search metadata for ad-hoc analysis of crashes, crash rates, and so forth. For more about searching MINT data, see Use the Splunk MINT App. You can also access the MINT data model for events. |
| Alerts | Integrates with third-party tools (JIRA, GitHub, HipChat, and Pivotal Tracker) to alert you when errors occur. | Create an alert based on any metric you want, such as a network call failure or increased latency, a crash rate in a new OS version, or a peak in usage. |
| New to Splunk Enterprise? |
This documentation applies to the following versions of Splunk MINT™ App (EOL): 2.2.0, 2.2.1, 3.0.0, 3.0.1, 3.0.2


 Download manual
Feedback submitted, thanks!