Use the Splunk MINT App
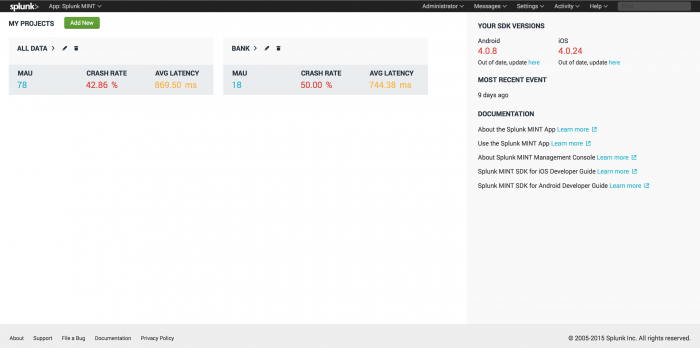
Each project in the Splunk MINT App aggregates data from a selection of mobile app projects that you created in Splunk MINT Management Console (each mobile app project corresponds to an API key). By default, an All Data project is created that contains all of your mobile app projects.
You can create new projects and specify exactly which mobile app projects to include. For example, you could create a project that aggregates data from only your Android apps, or a project that contains only those apps that have been released.
Select a project on the Splunk MINT App home page to view aggregated data and dashboards for the mobile apps in the project.
Create a new project
- On the Splunk Web home page, click Splunk MINT.
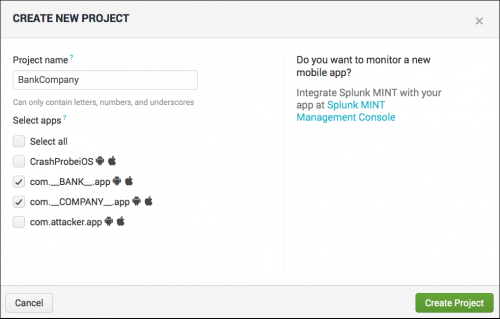
- Click Add New.
- Enter a project name, then select individual apps to include. Each app that is listed corresponds to a different package name.
- Click Create Project.
All of your Splunk MINT projects are listed.
- Note When apps use the same package name (such as apps in different phases of development), the data for those apps appears combined in the MINT App.
To view data for these apps separately, set a different application environment for each app (such as "testing" or "release"). Then, use the Environment filter in the MINT App to view data for a specific environment.
For more about setting the application environment, see Configuration options (Android) and Configuration options (iOS).
Your new project appears on the Splunk MINT home page. Click the project name to open it and view the dashboards.
Dashboards
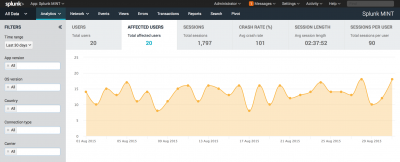
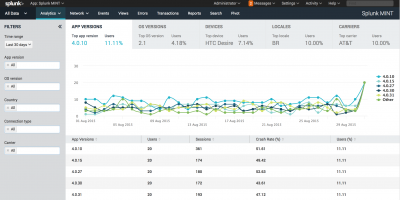
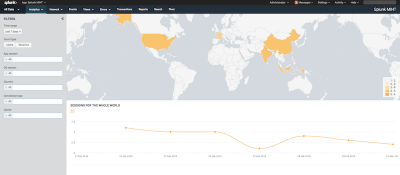
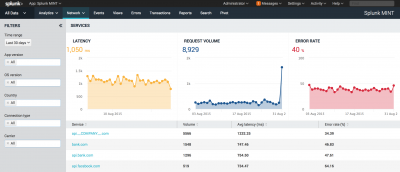
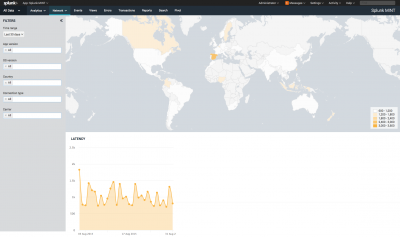
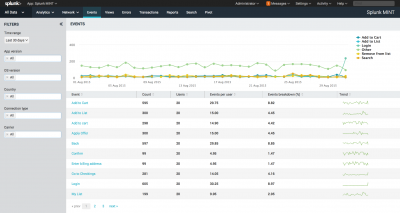
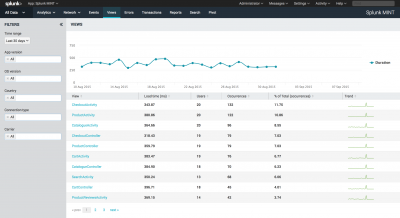
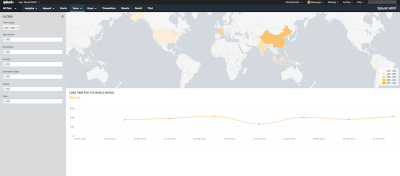
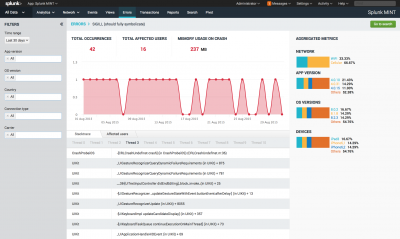
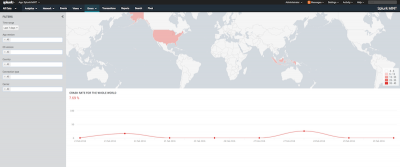
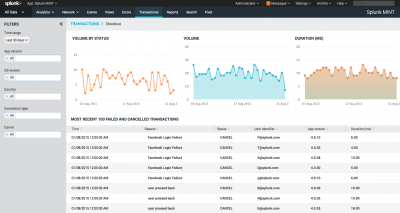
The dashboards in the Splunk MINT App contain many different categories of charts and tables displaying aggregate data for the apps you selected for your project:
- Note If you don't see data in the dashboards in Splunk MINT Management Console (such as network traffic or transaction data), you won't see any data in the Splunk MINT App either.
Saved reports
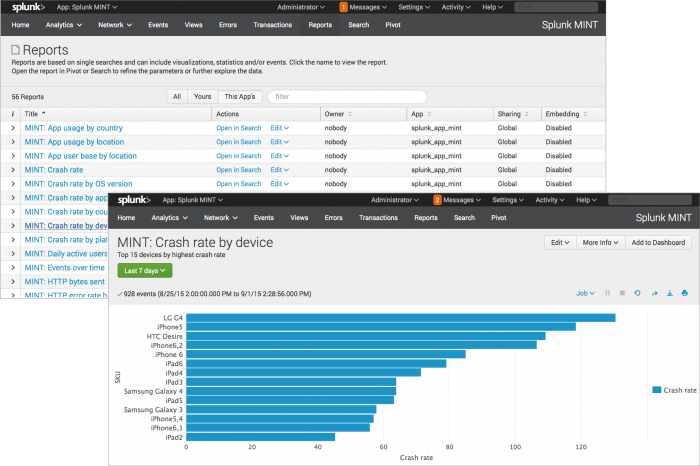
The Splunk MINT App provides more than 50 saved reports you can run for even more analysis. These reports are based on single searches and can include visualizations, statistics, and/or events.
Searches
Use the Splunk search language to create your own queries against the indexed data to view raw events.
- Search on tags and fields that are defined in the MINT data model. For example:
tag=mint platform=Android device=HTC* | top 5 carrier
- Search on fields that you define in the SDK, such as extra data (
extraData) or transactions by name (tr_name). For example:
tag=mint status=SUCCESS | stats avg(tr_duration) by tr_name
- Use the MINT sourcetypes:
"mint:event": Events."mint:error": Errors."mint:log": System output."mint:network": Network requests."mint:ping": Start of a session."mint:gnip": End of a session."mint:trstart": Start of a transaction."mint:trstop": End of a transaction.
- All errors contain a field called
errorHash, which groups different instances of the same error. You can use thiserrorHashto analyze different attributes that might be related.
Searches that use tags and fields defined in the MINT data model only work within the Splunk MINT App. If you want to create a search on MINT data from the main Search & Reporting app, search on index=mint.
Example search queries
To see events for slow network requests:
tag=mint sourcetype="mint:network" latency > 300
To display a timechart of occurrences of all events:
tag=mint sourcetype=mint:event | timechart count by event_name
To see a breakdown of a specific event by a particular extraData value:
tag=mint sourcetype=mint:event event_name="Purchase" | stats count by extraData.custom_key
To view the average memory consumption at the time of a crash:
tag=mint sourcetype=mint:error errorHash=dce17eec3cd21295877d6aef10439ce6 | stats avg(memAppAvailable)
To view the number of user affected by crashes in version 0.1.7.7:
sourcetype=mint:error appVersionName="0.1.7.7" | timechart dc(uuid)
To list all of your users by user ID and API key:
tag=mint userIdentifier="*" | table userIdentifier, apiKey | dedup userIdentifier
To summarize error information (platform, OS, device, and error message) for a specific user "elvis@splunk.com":
sourcetype=mint:error userIdentifier="elvis@splunk.com" | table platform, osVersion, device, message
To see the most-viewed screens:
sourcetype=mint:view | stats count by current
To see the worst-performing slowest screens:
sourcetype=mint:view | stats avg(loadTime) AS avgLoadTime by currentView | sort -avgLoadTime
To see the time spent on by screen:
sourcetype=mint:view | stats avg(elapsedTime) AS TimeSpent by previous | sort -TimeSpent
To see the most common user path:
sourcetype=mint:view | eval UserPath="From: ".current." To: ".previous | stats count by UserPath | sort -count
To see the least-viewed features:
sourcetype=mint:view | stats dc(uuid) as Users by current | sort Users
To see the slowest-performing screen over time:
sourcetype=mint:view | timechart avg(loadTime) by current
Export data
You can export your MINT data to different formats (including CSV, JSON, and XML) from your search results. For example, you can run a search or a report, and then export the number of results you want to the format you choose. For more about how to export data, see "Export search results" in the Search Manual.
| Install and configure the Splunk MINT App | MINT user roles |
This documentation applies to the following versions of Splunk MINT™ App (EOL): 2.2.0, 2.2.1, 3.0.0, 3.0.1, 3.0.2
 Download manual
Feedback submitted, thanks!