Use the timeline to investigate events
The timeline is a visual representation of the number of events in your search results that occur at each point in time. The timeline shows the distribution of events over time. When you use the timeline to investigate events, you are not running a new search. You are filtering the existing search results.
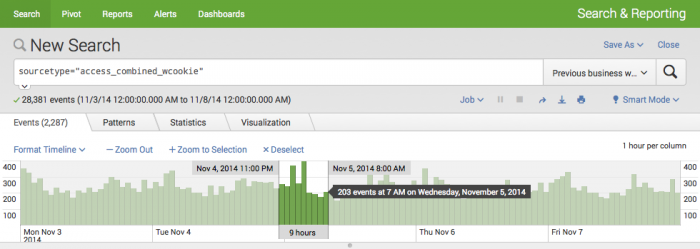
You can use the timeline to highlight patterns or clusters of events or investigate peaks (spikes in activity) and lows (possible server downtime) in event activity. Position your mouse over a bar to see the count of events. Click on a bar to drill-down to that time range.
Change the timeline format
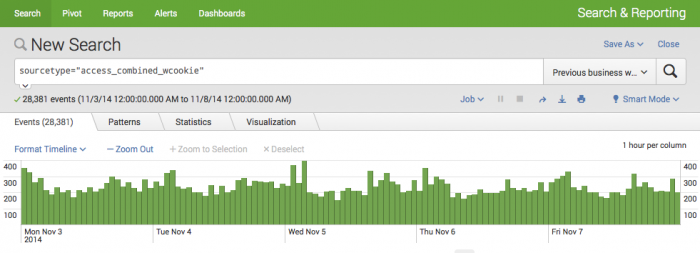
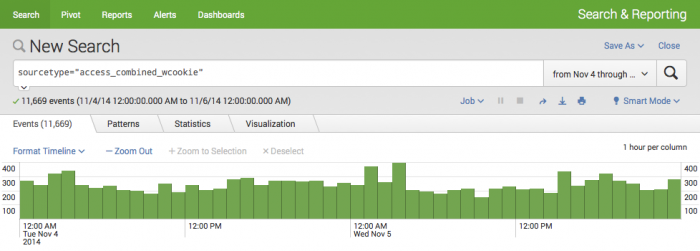
The timeline is located in the Events tab above the events listing. It shows the count of events over the time range that the search was run. Here, the timeline shows web access events over the Previous business week.
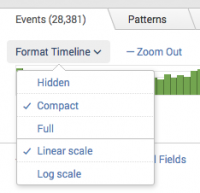
Format options are located in the Format Timeline menu:
You can hide the timeline (Hidden) and display a Compact or Full view of it. You can also toggle the timeline scale between linear (Linear Scale) or logarithmic (Log Scale).
When Full is selected, the timeline is taller and displays the count on the y-axis and time on the x-axis.
Zoom in and zoom out to investigate events
Zoom and selection options are located above the timeline. At first, only the Zoom Out option is available.
The timeline legend is on the top right corner of the timeline. This indicates the scale of the timeline. For example, 1 minute per column indicates that each column represents a count of events during that minute. Zooming in and out changes the time scale. For example, if you click Zoom Out the legend will indicate that each column now represents an hour instead of a minute.
When you mouse over and select bars in the timeline, the Zoom to Selection or Deselect options become available.
Mouse over and click on the tallest bar or drag your mouse over a cluster of bars in the timeline. The events list updates to display only the events that occurred in that selected time range. The time range picker also updates to the selected time range. You can cancel this selection by clicking Deselect.
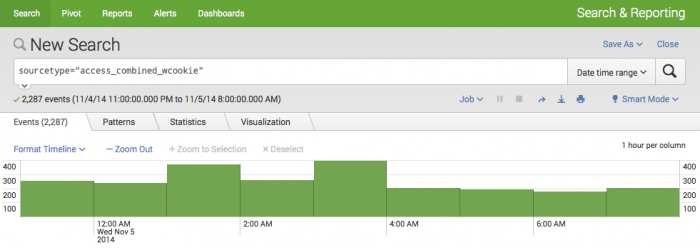
When you Zoom to Selection, you filter the results of your previous search for your selected time period. The timeline and events list update to show the results of the new search.
You cannot Deselect after you zoomed into a selected time range. But, you can Zoom Out again.
| Classify and group similar events | Drill down on event details |
This documentation applies to the following versions of Splunk® Enterprise: 7.0.0, 7.0.1, 7.0.2, 7.0.3, 7.0.4, 7.0.5, 7.0.6, 7.0.7, 7.0.8, 7.0.9, 7.0.10, 7.0.11, 7.0.13

 Download manual
Feedback submitted, thanks!