Create a pivot table
In the previous topic you used Pivot to find the total number of purchase requests and saved the single value display as a report. In this topic, you will use the Pivot visualization editor to create a pivot table of the Buttercup Games Successful Purchases dataset.
The Successful Purchases dataset has fields for the products purchased from the Buttercup Games website. This includes the automatically extracted fields, such as categoryId and productId, as well as the lookup fields, price and product_name, that you added when you built the dataset.
The Buttercup Games online store sells hundreds products, in of a variety of categories. You want to know more about the items that were purchased over the past week. You can create a pivot report that breaks down the total number of purchase events by product name. Using the report, you can quickly see which of the products were the top sellers for that period.
Define a new pivot
- From the Splunk bar, select Settings > Data models.
- Select the Buttercup Games data model.
- In the Datasets editor page, click Pivot. In the Select a Dataset page, select the Successful Purchases child dataset.
The New Pivot editor for Successful Purchases opens.

Add pivot elements
You can add multiple elements from each pivot element category to define your pivot table. It's easy to add, define, and remove pivot elements in the process of determining what information your table should provide.
- To add a pivot element: Click the + icon. This opens up the element dialog, where you choose a field and then define how the element uses that field.
- To inspect or edit an element: Click the "pencil" icon on the element. This opens the element dialog.
- To reorder and transfer pivot elements: Drag and drop an element within its pivot element category to reorder it. Drag and drop elements between element categories to transfer them.
- To remove pivot elements from the Pivot Editor: Open its element dialog and click the Remove button, or drag the element up or down until it turns red and drop it.
Under Filters, the time filter is always present when you build a pivot; you cannot remove it. It defines the time range for which the pivot returns results. It operates exactly like the time range menu that is in use throughout Splunk Web. For more information, see Select time ranges to apply to your search in the Search Manual.
Change the time range filter
Currently your Pivot table shows a single value, the total count of Successful Purchases over All time.
Change the time range to view the Successful Purchases over a different time range:
- Under Filters, click the pencil icon to open the time range picker.
- In the Presets list under the Relative column, click Last 7 days.


If no events are returned, it simply means that you downloaded the tutorialdata.zip file more than a week ago. Select a longer time range, such as Previous month or you can keep the default time range, All time.
Add a Split Row element
You can add pivot elements to see the Count of Successful Purchases for each product by name:
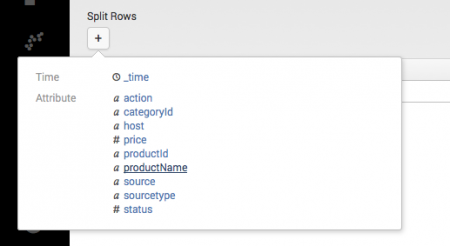
- Under Split Rows, click + and select productName.
- This is the lookup field that contains the name of each product. This field is based on the
productIdfield in the events.
- A dialog box opens where you can format the field.
- This is the lookup field that contains the name of each product. This field is based on the
- For Label, type Product Name.
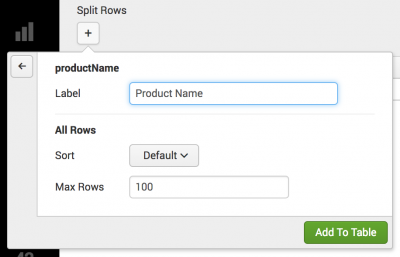
- Click Add To Table.
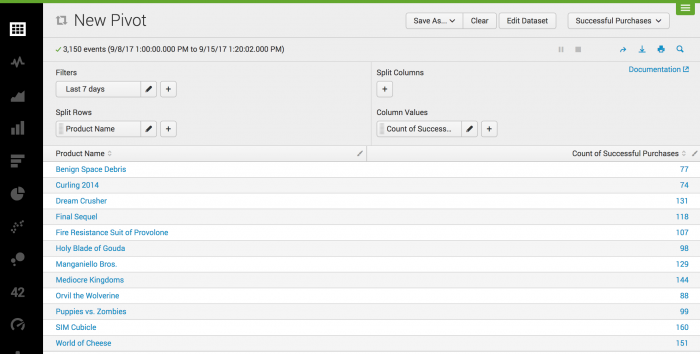
- The table shows the count of successful purchases for the past 7 days for each product.


Add a Column Value element
Now you want the table to show the total revenue earned for each product that was successfully purchased.
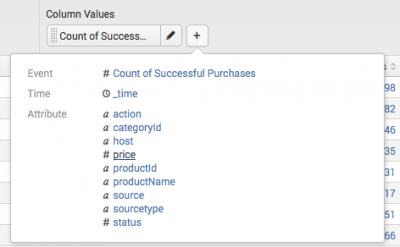
- Under Column Values, click + and select
price.
- In the dialog box, specify how you want the information to appear in the table.
- For Label, type Total Revenue.
- For Value, select Sum.
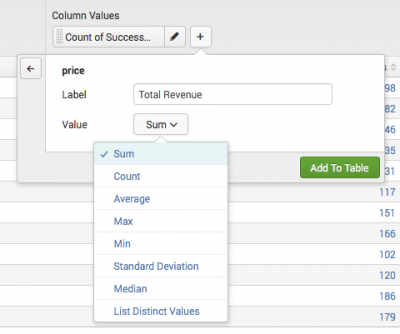
- This creates a field called Total Revenue, which is the summation of the price for each successful purchase of the product.
- You can add the
pricevalues as another Split Row, if you want to see the cost of each individual product in this table. - Click Add To Table.
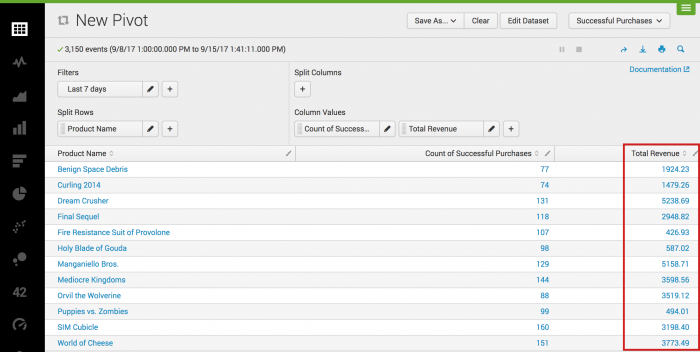


The table shows the new Total Revenue column with the total amount earned from the purchases of each product.
Save the pivot table
Now it is time to save the pivot table as a report.
- Click Save As and select Report.
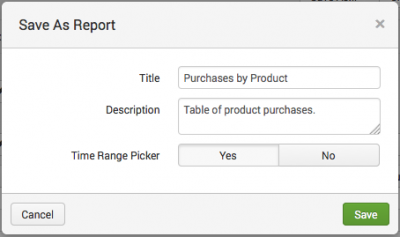
- For Title, type
Purchases by Product. - Optional. For Description type Table of Product Purchases.
- For Time Range Picker, the Yes setting should already be selected.
- Click Save.
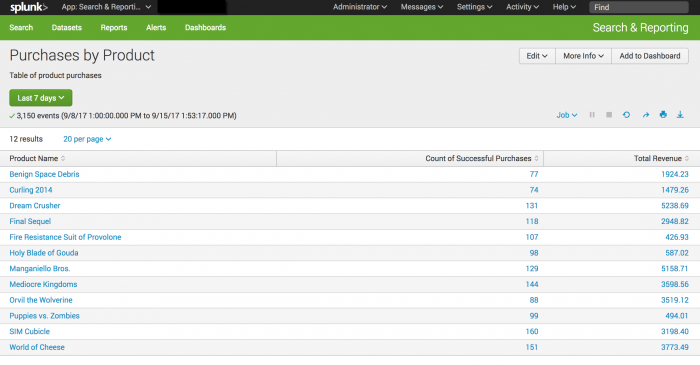
- In the Your Report Has Been Created dialog box, click View.


Next steps
Continue to the next topic to create some simple pivot visualizations.
| Create and save a pivot report | Create a pivot chart |
This documentation applies to the following versions of Splunk® Enterprise: 7.0.0, 7.0.1, 7.0.2, 7.0.3, 7.0.4, 7.0.5, 7.0.6, 7.0.7, 7.0.8, 7.0.9, 7.0.10, 7.0.11, 7.0.13
Feedback submitted, thanks!