What is Splunk Dashboard Studio?
Splunk Dashboard Studio provides tools to customize dashboards in Splunk, such as designing your dashboard's layout, colors, images, and more.
Dashboard Studio is included with Splunk Enterprise and Splunk Cloud Platform as a default application. Disabling this default application may lead to unpredictable behavior.
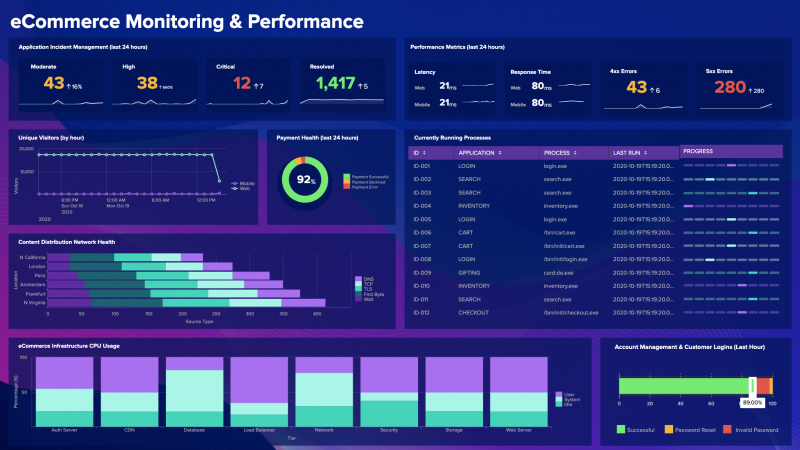
The following image is an example of a dashboard created using the Splunk Dashboard Studio.
Layout options
The Search & Reporting app uses a structure that snaps visualizations to a row-column structure. The new framework includes two different layout options, absolute and grid.
When you use the absolute layout option, you can use your mouse or keyboard to drag and drop and resize objects on your dashboard. This layout also gives you pixel-perfect control and customizable backgrounds. When you use the absolute layout, the new visual editor allows you to add shapes, custom images, and icons to your dashboards and create searches in the form of data sources.
In the grid layout, you use a grid system to snap charts into rows. The grid layout allows you to create large dashboards quickly, but doesn't have most of the options available in the absolute layout. To see how the two compare, see Compare absolute and grid layouts.
Source code
Unlike the classic format, which uses Simple XML as the source code, the source code for this framework uses JSON-formatted components, or stanzas, in the dashboard and visualization workflow. Since each stanza is visually separate from the others, you can modify individual visualizations, searches, inputs, and global defaults, more easily compared to using Simple XML.
While you can open Simple XML dashboards in the Dashboard Studio, some dashboard elements might not translate and you'll receive an error message. For the best result, open dashboards with supported inputs, without tokens, and without code that is not Simple XML. For example, if you try to export dashboards that use JavaScript and CSS extensions, the dashboard might not render. To ensure your dashboard is fully operational, create it within the Dashboard Studio.
Additionally, you must use the source editor to set some options for visualizations, data sources and the layout. You must use the source editor to create dynamic inputs and tokens.
Compare classic Splunk Dashboards (Simple XML) and the Splunk Dashboard Studio
The Splunk Dashboard Studio is a new way for you to build Splunk dashboards using a variety of tools for greater customization. While many features and visualizations are similar to the classic Splunk dashboard framework, there are differences, both in what features are available in the new framework and the way visualizations look.
The following tables display which features are supported by what framework. This list will change with each new release of the Splunk Dashboard Studio.
Visualizations
Not all formatting options that are available in the classic framework are available in the Splunk Dashboard Studio. For more information on Simple XML visualizations, see Simple XML visualization reference in the Dashboards and Visualizations manual. Some features, like thresholding and other trend coloring options, are configured differently in the Dashboard Studio than the way they are configured using Simple XML.
Some options for visualizations in the Splunk Dashboard Studio can only be configured using the source editor. The options available for each visualization, and where you configure them, are listed in the specific visualization topics and in the Object options reference.
Some formatting options are only available in the Dashboard Studio and not in the classic framework. For example, you can use the new Action menu when you select objects in Edit mode to layer, copy, and delete those objects.
Use the following table to get an overview of supported features for both classic Splunk Dashboards (Simple XML) and the new Splunk Dashboard Studio:
| Visualization | Classic Dashboards | Dashboard Studio | Notes |
|---|---|---|---|
| 3rd party visualizations | Yes | No | N/A |
| Splunk-built custom visualizations | Yes | No | If you are using Dashboard Studio, certain custom visualizations are now added as default visualizations. |
| Area and line charts | Yes | Yes | N/A |
| Bar and column charts | Yes | Yes | N/A |
| Bubble chart | Yes | Yes | N/A |
| Choropleth Maps (USA and World) | Yes | Yes | If you are using Dashboard Studio, the process of creating and formatting choropleth maps is different than in Simple XML. For more information, see Generate a choropleth map. |
| Choropleth SVG images | No | Yes | If you are using Dashboard Studio, you can use custom SVG images to create custom choropleth visualizations by connecting them to your Splunk data. |
| Cluster maps | Yes | Yes | N/A |
| Events viewer | Yes | No | If you are using Dashboard Studio, you can use the table visualization for a similar effect. |
| Filler and marker gauges | Yes | Yes | N/A |
| Pie chart | Yes | Yes | If you are using Dashboard Studio, you can use the option to turn a pie chart into a donut chart. |
| Scatter chart | Yes | Yes | N/A |
| Shapes, lines, text boxes, icons, and images | No | Yes | If you are using Dashboard Studio, you can add and edit shapes and text boxes in the new app. You can use default Splunk icons, or use custom icons. You can use custom images for your dashboard backgrounds or as individual visualizations. |
| Singe value and single value radial | Yes | Yes | N/A |
| Single value icon | No | Yes | If you are using Dashboard Studio, you can use this option to add a custom icon to a single value visualization. |
| Table | Yes | Yes | N/A |
| Trellis | Yes | No | N/A |
Data use
Some data source options can only be set in source mode. These options are listed under the data source topic they apply to.
| Feature | Classic Splunk | Splunk Dashboard Studio | Notes |
|---|---|---|---|
| Data source types | No | Yes | If you are using Dashboard Studio, data sources are designated a type depending on the data they use. For using test data, you use ds.test. If you are using an SPL search, the data source type is, ds.search. To use a saved search, or report, use the ds.savedSearch data type. For chain searches, use ds.chain
|
| Base and chain searches | Yes | Yes | If you are using Dashboard Studio, you can configure chain searches directly in the visual editor. For more information see Chain searches together with a base search and chain searches. |
| Saved searches (reports) | Yes | Yes | If you are using the Dashboard Studio, you can only reference saved searches (reports) using the source editor. For more information, see Use reports and saved searches with ds.savedSearch. |
| Scheduled saved searches | Yes | Yes | If you are using the Splunk Dashboard Studio, when using a scheduled saved search, the schedule of the search is always respected over all other settings. |
Dashboard features
Dashboard-level features such as defaults and inputs, can affect entire dashboards.
| Feature | Classic Splunk | Splunk Dashboard Studio | Notes |
|---|---|---|---|
| Inputs | Yes | Yes | If you are using the Splunk Dashboard Studio, inputs can be added, arranged, and deleted in the visual editor. You can also set static key/value pairs. Any dynamic options but must be configured in the source editor. For more information, see Use inputs and tokens to make dashboards dynamic. Radio, checkbox, and link list inputs are not supported. |
| Dashboard defaults | Yes | Yes | If you are using the Splunk Dashboard Studio, setting defaults for a dashboard offers different levels of specification. For more information on using defaults, see Use the defaults section to create global settings. |
| Drilldown | Yes | Yes; limited. | If you are using the Splunk Dashboard Studio, you can only drilldown to internal directories or external URLs. You can use tokens in the URL. |
| Tokens | Yes | Yes; limited | If you are using Splunk Dashboard Studio, tokens can only be generated using inputs. |
| Tokens in base, chain, and saved searches | Yes | Yes | N/A |
| Layouts | Row-column layout | Absolute and grid layouts | If you are using the Splunk Dashboard Studio, the absolute layout is a free-form editing experience. The grid layout snaps your visualization panels to rows that change size with the largest visualization. |
| Content export - single visualizations | No | Yes | If you are using the Splunk Dashboard Studio, you can select individual visualizations to download in PNG format. For more information, see Download a visualization. |
| Content export - dashboards | Yes; limited | Yes | The classic Splunk Dashboard framework allows you to download dashboards in PDF format. If you are using the Splunk Dashboard Studio, you can download a dashboard in a single PDF or PNG image. The result will look exactly the same as the dashboard appears in View mode. Dashboard Studio currently does not support scheduled PDF export. For more information, see Download a dashboard. |
| Custom Javascript (JS) | Yes | No | N/A |
| Cascading Style Sheets (CSS) | Yes | No | N/A |
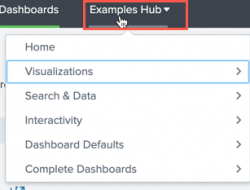
Splunk Dashboard Studio Examples Hub
The Examples Hub is a tab that you can access from any landing page in the Splunk Dashboard Studio. There are five options to choose from. Each one explores a different area of the new framework and offers many popular use cases. They also include visualization panels, their source code, and the run anywhere SPL search used to create the example.
To select the complete source code of an example dashboard or visualization, double-click to highlight it and use control or command + c to copy and control or command + v to paste it into your own environment.
- Visualizations
Select this option to view examples, example code, and the SPL search used for each visualization available in the app. - Search & Data
Select this option to see examples of the following data source types: - Inline Search
Select this option to view examples of inline, or ad hoc, data sources and their searches. - Base and Chain Search
Select this option to view examples of how to create base and chain data sources and their searches - Saved Search
Select this option to view examples of how to create searches that used saved searches, or reports in data sources. - Test Data
Select this option to view examples of how to create data sources using mock data that mimics an actual search. - Interactivity
Select this option to view information on the following interactive options: - Inputs
Select this option to learn how and when to configure text, dropdown, mutliselect, and cascading inputs. - Drilldown
Select this option to learn how to configure drilldown for visualizations. - Dashboard defaults
Select this option to learn how to use set global defaults for data sources and visualizations. - Complete Dashboards
Select this option to view many different dashboards and their dashboard definitions.
| Migrate your dashboards and delete the Splunk Dashboards app (beta) |
This documentation applies to the following versions of Splunk® Enterprise: 8.2.1, 8.2.2, 8.2.3, 8.2.4, 8.2.5, 8.2.6, 8.2.7, 8.2.8, 8.2.9, 8.2.10, 8.2.11, 8.2.12


 Download manual
Feedback submitted, thanks!