When users view a dashboard, they can make a menu appear by selecting a visualization. The panel menu appears at the top right of the visualization. The following options are available:
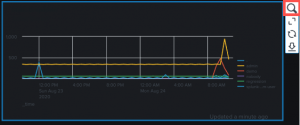
Open in search
Users with admin permissions can click the magnifying glass on a selected visualization to open the search driving the visualization in an interface similar to the Search & Reporting app, while remaining in the Dashboard Studio.
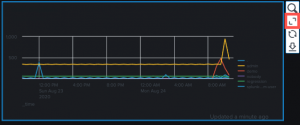
Expand the visualization
Click the full screen icon to view the visualization panel in full screen mode. Press the escape (esc) key to exit full screen mode.
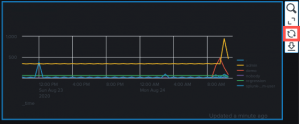
Refresh the search driving the visualization
Click the refresh icon to refresh the visualization.
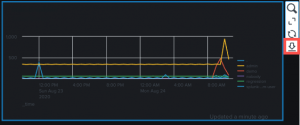
Download a visualization
Click the download icon to download individual visualizations in PNG format.
| How the dashboard definition is structured in the source editor | Download a dashboard |
This documentation applies to the following versions of Splunk® Enterprise: 8.2.1, 8.2.2, 8.2.3, 8.2.4, 8.2.5, 8.2.6, 8.2.7, 8.2.8, 8.2.9, 8.2.10, 8.2.11, 8.2.12


 Download manual
Feedback submitted, thanks!