Advanced dynamic options syntax
You can configure dynamic visualizations further by directly editing the source code in the source code editor. The following examples take a deeper dive into each element of the visualization stanza, demonstrate how to leverage dynamic options syntax (DOS) defaults to condense the source code, and explain the default behavior of options and values.
Example of dynamically updating values and trends
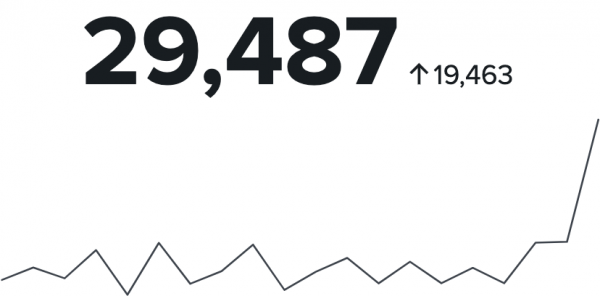
The following example represents a single value visualization changing its value each time the data source updates.
/* JSON */

"type": "splunk.singlevalue",
     "dataSources": {
           "primary": "ds_sales"
     },
     "options": {
          "sparklineValues": "> primary | seriesByName('count')",
          "majorValue": "> primary | seriesByName('count') | lastPoint()",
          "trendValue": "> primary | seriesByName('count') | delta(-2)"
     }
The visualization stanza has a type, data source, and options. type designates the visualization as a single value. dataSources identifies the primary data source as ds_sales. The contents of options configures the visualization's illustrative specifics using DOS.
Options
options contains three properties using DOS, sparklineValues, majorValue, and trendValue.
sparklineValues accesses data from primary and uses the selector function seriesByName to focus on the field count. Each time count updates, the line graph in the visualization updates with a new point.
"sparklineValues": "> primary | seriesByName('count')"
Similar to sparklineValues, majorValue accesses data from primary and uses the selector function seriesByName. majorValue differs from sparklineValues by utilizing the additional selector function lastPoint which specifies that the major value displays the latest point in the series. The latest point in the series is 29,487.
"majorValue": "> primary | seriesByName('count') | lastPoint()"
trendValue accesses data from primary, uses the selector function seriesByName and the additional selector function delta(-2).
"trendValue": "> primary | seriesByName('count') | delta(-2)"
trendValue uses the selector function delta(-2) to return the difference between the second to last point and last point in seriesByName(`count`). The difference is 19,463 sales, which indicates an upward trend.
For a list of single value options and their defaults, see Object options and defaults reference.
Example of dynamically updating color
The following example represents a single value visualization dynamically updating its color based on a range of values.
/* JSON */

"type": "splunk.singlevalue",
            "options": {
                "majorColor": "> majorValue | rangeValue(majorColorEditorConfig)",
                "sparklineValues": "> primary | seriesByName('count')",
                "trendDisplay": "off",
                "sparklineDisplay": "off"
            },
            "dataSources": {
                "primary": "ds_sales"
            },
            "context": {
                "majorColorEditorConfig": [
                    {
                        "value": "#9E2520",
                        "to": 20
                    },
                    {
                        "value": "#692A21",
                        "from": 20,
                        "to": 40
                    },
                    {
                        "value": "#333022",
                        "from": 40,
                        "to": 60
                    },
                    {
                        "value": "#224468",
                        "from": 60,
                        "to": 80
                    },
                    {
                        "value": "#115BAD",
                        "from": 80
                    }
                ]
            }
Visualization Data Sources
majorColor receives up-to-date numerical results from the data source majorValue to assign the correct color to its single value visualization.
Context
In addition to leveraging other object options, majorColor also uses the formatting function rangeValue to collect a range of colors from majorColorEditorConfig which resides within context.
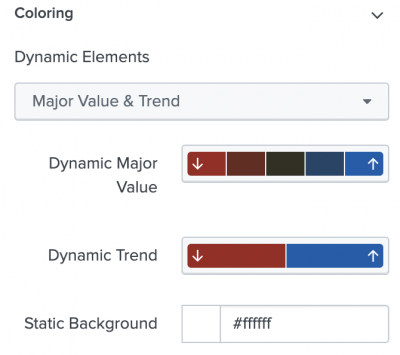
Nested within context, majorColorEditorConfig defines a range of hex colors triggered by five different thresholds:
- X < 20: #9E2520 (red)
- 20-40: #692A21 (dark red)
- 40-60: #333022 (black)
- 60-80: #224468 (dark blue)
- X > 80: #115BAD (blue)
Expanding the DOS
As shown in the code example, majorColor condenses its dynamic options syntax (DOS) by leveraging the defaults of majorValue and sparklineValues. Condensing the DOS provides a more concise source code but also limits flexibility for custom configuration.
Deconstructing majorValue and sparklineValues to their defaults expands the DOS and presents more opportunities for tailored visualizations.
# Condensed DOS
"majorColor": "> majorValue | rangeValue(majorColorEditorConfig)"

# majorValue expanded into its default
"majorColor": "> sparklineValues | lastPoint() | rangeValue(majorColorEditorConfig)"

# sparklineValues expanded into its default
 "majorColor": "> primary | seriesByPrioritizedTypes("number", "string", "time") | lastPoint() | rangeValue(majorColorEditorConfig)"
With an expanded DOS, you can change the dynamic options to your specific needs, such as switching the selector function lastPoint to firstPoint , or changing the formatting function matchValue to rangeValue.
For a list of single value options and their defaults, see Object options and defaults reference.
Default behavior for options and values
When initially creating a visualization with the visual editor UI, some default dynamic options and values may not appear in the source code editor. If you manually change an option from its default, the associated dynamic options and values appear in the source editor.
Example of default behavior with a single value
If you add a single value visualization to a dashboard with the visual editor UI, the source code reflects an empty options object.
/* JSON */

"type": "splunk.singlevalue",
           "options": {},
           "dataSources": {
               "primary": "ds_GKMxa5yt"
           }
When you select dynamic elements, such as Major Value and Trend, in the visual editor UI, the source code fills the options object with the associated options and values, and adds the context object.
/* JSON */

"type": "splunk.singlevalue",
           "options": {
               "majorColor": "> majorValue | rangeValue(majorColorEditorConfig)",
               "trendColor": "> trendValue | rangeValue(trendColorEditorConfig)"
           },
           "dataSources": {
               "primary": "ds_GKMxa5yt"
           },
           "context": {
               "majorColorEditorConfig": [
                    {
                        "value": "#9E2520",
                        "to": 20
                    },
                    {
                        "value": "#692A21",
                        "from": 20,
                        "to": 40
                    },
                    {
                        "value": "#333022",
                        "from": 40,
                        "to": 60
                    },
                    {
                        "value": "#224468",
                        "from": 60,
                        "to": 80
                    },
                    {
                        "value": "#115BAD",
                        "from": 80
                    }
                ],
                "trendColorEditorConfig": [
                    {
                        "value": "#9E2520",
                        "to": 0
                    },
                    {
                        "value": "#115BAD",
                        "from": 0
                    }
                ]
           }
       }
Selector and formatting functions
Selector functions select the data of interest when configuring a dynamic option. Formatting functions transform and map the data into the desired format.
For more details, see the choices for selector and formatting functions.
Defaults for selector and formatting functions
Some dynamic options use selector or formatting functions as a default. You can make adjustments to all default functions, depending on the data you want returned. For example, perhaps a dynamic option uses lastPoint as a default selector function, but you'd rather use firstPoint. You can make that change, and other configuration changes, in the source code editor.
| Add dynamic options to visualizations | Charts |
This documentation applies to the following versions of Splunk® Enterprise: 8.2.0, 8.2.1, 8.2.2, 8.2.3, 8.2.4, 8.2.5, 8.2.6, 8.2.7, 8.2.8, 8.2.9, 8.2.10, 8.2.11, 8.2.12


 Download manual
Feedback submitted, thanks!