Link to a search
You can create a drilldown that links users to search results for a clicked value. Users can view events to get more information on the value that they click.
How linking to a search works
Linking to a search lets users explore additional fields, values, and other data related to the value they click. You can use a default search or customize the search that opens on a user click.
Use the default search
A secondary search generates automatically to show more information about the clicked value. This search is similar to the search driving the source visualization but generates results that are more specific to the clicked value.
Customize the search
You can customize the secondary search to generate different results. For example, you might want to show results for a separate data set or include different fields or commands in the search string.
You can use predefined tokens to include the clicked value in the search.
Example
This column chart shows event counts by sourcetype over the last week.

The chart is generated using the following search string.
index = _internal | stats count by sourcetype
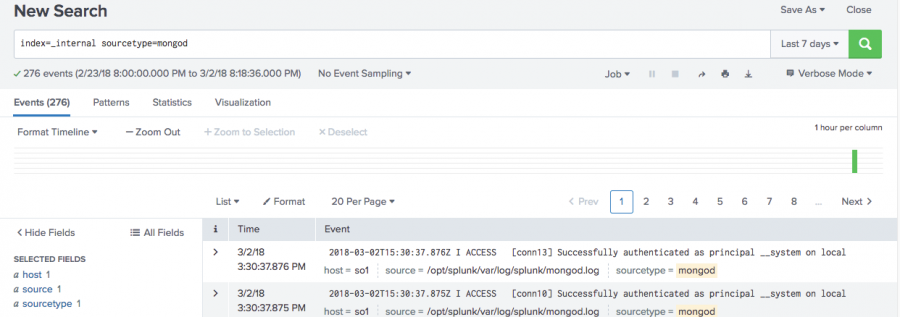
Drilldown linking to a default search is enabled on the chart. If a user clicks the mongod sourcetype column in the chart, a secondary search opens. This search removes aggregations and generates an events list for the mongod sourcetype value.
Users can explore details for the mongod sourcetype that were not available in the column chart.
Configure the drilldown in the drilldown editor
You can use the drilldown editor to enable drilldown and configure linking to a search.
To create conditional or other advanced behaviors in a drilldown, use Simple XML. An error message appears if you access the drilldown editor in panels with existing advanced configurations.
Prerequisites
Some default drilldown settings are new in software version 6.6.0. Review drilldown defaults and customization in Use drilldown for dashboard interactivity.
Steps
- From the dashboard where you want to configure drilldown, click Edit to open the dashboard editor.
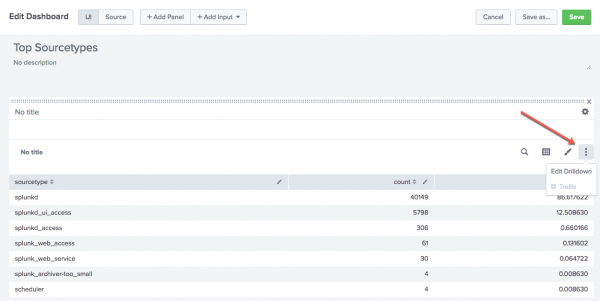
- Find the panel where you are configuring drilldown. Click the additional options button and select Edit drilldown.

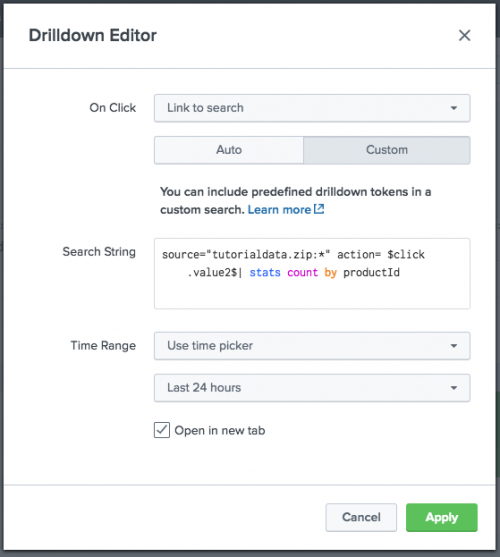
- Select Link to search.
- Select a search type.
- "Auto" generates a default search to remove aggregations and filter for values from the clicked element.
- Select "Custom" to input a search string and time range.
- (Optional) Opt to open the search in a new browser tab.
- Click Apply to apply the drilldown settings.
- Click Save to save your dashboard changes.
Configure the drilldown in Simple XML
Click Edit to open the dashboard editor and click Source to access Simple XML source code.
Drilldown defaults and customization
Some default drilldown settings are new in software version 6.6.0. Review drilldown defaults and customization in Use drilldown for dashboard interactivity.
Enable the drilldown
Find the <option name="drilldown">none</option> element in the visualization. Change the option to enable and focus the drilldown. For example, in a table visualization, use <option name="drilldown">cell</option> to enable drilldown on table cells.
Once enabled, the drilldown links to a default search in the same browser tab.
Search syntax
Default search
Use the Simple XML <option> for the visualization where you are enabling drilldown. For example, the following source code in a bubble chart adds a drilldown linking to a search.
<option name="charting.drilldown">all</option>
Check the Simple XML Reference to review the <option> name and syntax to use for each visualization.
Custom search
In your dashboard source code, add the <drilldown> element to customize the linked search.
This example uses the target attribute to open the search in a new browser tab. The drilldown links to the search page and uses the q parameter to pass in the custom search string.
<drilldown>
    <link target="_blank">search?q=index=_internal | stats count by sourcetype</link>
</drilldown>
Link to custom search example
You can customize a drilldown to change the results that users see when the secondary search opens.
Default search
This search generates a table aggregating customer actions on a retail website.
source="my_retail_data_source" | stats count by action
Drilldown linking to a default search is enabled in the table. The default search removes the aggregation by sourcetype and filters events for the selected sourcetype column. If a user clicks on the addtocart action, the following secondary search opens.
source="my_retail_data_source" action="addtocart"
The default search filters results for the selected action. You might want to show more specific details. To override this default behavior, create a custom secondary search in the drilldown editor or in Simple XML.
Customizing the search
Customize the drilldown search to show users more information about the products involved in customer actions. The following search string uses the $click.value2$ predefined token to capture the action that users click and filter product counts for it.
source="my_retail_data_source" action=$click.value2$ | stats count by productId
Customizing the search in the drilldown editor
In the drilldown editor, you can change the default search to a custom search. Input the search string and configure time range parameters as needed.
Customizing the search in Simple XML
You can use Simple XML to create the same custom search behavior. In the table visualization element, add the following source code.
<drilldown>
    <link target="_blank">search?q=source="my_retail_data_source" action=$click.value2$ | stats count by productId</link>
</drilldown>
The drilldown uses the $click.value2$ predefined token to capture the action that users click and use it in the search.
You can add custom time range parameters to the search. Use the <![CDATA[]]> wrapper or HTML character entities to escape the & ampersand or other special characters.
This example sets the time range for the last twenty-four hours.
<drilldown>
    <link target="_blank">
      <![CDATA[
        search?q=source="my_retail_data_source" action=$click.value2$ | stats count by productId&earliest=-24h@h&latest=now
         ]]>
    </link>
</drilldown>
For more syntax details, see the <link> element in the Simple XML Reference.
| Use drilldown for dashboard interactivity | Link to a dashboard |
This documentation applies to the following versions of Splunk® Enterprise: 7.1.0, 7.1.1, 7.1.2, 7.1.3, 7.1.4, 7.1.5, 7.1.6, 7.1.7, 7.1.8, 7.1.9, 7.1.10, 7.2.0, 7.2.1, 7.2.2, 7.2.3, 7.2.4, 7.2.5, 7.2.6, 7.2.7, 7.2.8, 7.2.9, 7.2.10, 7.3.0, 7.3.1, 7.3.2, 7.3.3, 7.3.4, 7.3.5, 7.3.6, 7.3.7, 7.3.8, 7.3.9, 8.0.0, 8.0.1, 8.0.2, 8.0.3, 8.0.4, 8.0.5, 8.0.6, 8.0.7, 8.0.8, 8.0.9, 8.0.10, 8.1.0, 8.1.1, 8.1.2, 8.1.3, 8.1.4, 8.1.5, 8.1.6, 8.1.7, 8.1.8, 8.1.9, 8.1.10, 8.1.11, 8.1.12, 8.1.13, 8.1.14, 8.2.0, 8.2.1, 8.2.2, 8.2.3, 8.2.4, 8.2.5, 8.2.6, 8.2.7, 8.2.8, 8.2.9, 8.2.10, 8.2.11, 8.2.12, 9.0.0, 9.0.1, 9.0.2, 9.0.3, 9.0.4, 9.0.5, 9.0.6, 9.0.7, 9.0.8, 9.0.9, 9.0.10, 9.1.0, 9.1.1, 9.1.2, 9.1.3, 9.1.4, 9.1.5, 9.1.6, 9.1.7, 9.1.8, 9.1.9, 9.2.0, 9.2.1, 9.2.2, 9.2.3, 9.2.4, 9.2.5, 9.2.6, 9.3.0, 9.3.1, 9.3.2, 9.3.3, 9.3.4, 9.4.0, 9.4.1, 9.4.2


 Download manual
Feedback submitted, thanks!