Using events lists
Add an events list to a dashboard to give users access to the events, fields, and values generated by a search. An events list does not abstract or process search results like a chart or other visualization does.
Generate an events list
The content in an events list depends on the search that you run. There are no additional data format requirements.
Prerequisites
Review Configuration options.
Steps
- From the Search page, run a search.
- Select the Events tab to view the events list.
- (Optional) Select Save as > Existing Dashboard or New Dashboard to add the events list to a dashboard.
- (Optional) Use the Format menu or Simple XML to configure the events list.
Configuration options
Use the Format menu to configure one or more of the following events list components. You can also adjust these components and make additional configurations using Simple XML.
Display and format options
Use the following settings to adjust events list appearance.
- Choose an events display option.
- List (default): Show timestamps for each event separately.
- Raw: Show raw events.
- Table: Display events as a table. This format is different from the Statistics table visualization.
- Configure row numbers, wrapping, and maximum lines
Drilldown
Use the drilldown editor and/or Simple XML to enable and configure drilldown on an events list. See Use drilldown for dashboard interactivity for more details on enabling and configuring drilldown.
When configuring drilldown on an events list in Simple XML, you can specify one of the following drilldown settings to provide different segment selection options.
Note: Event segmentation processing for events with long single lines of text can cause browser performance issues.
For more details, see Types of event segmentation in the Knowledge Manager Manual.
Use case scenario
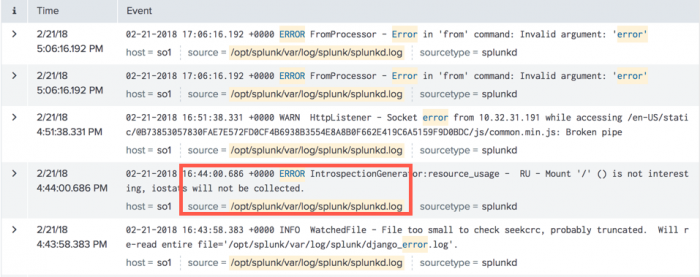
An admin uses an events list to give users access to recent notable system events. To generate the events list, the admin runs the following search.
error OR failed OR severe OR ( sourcetype=access_* ( 404 OR 500 OR 503 ) )
The admin adds the events list to a dashboard tracking system status. Dashboard users can click on event fields or a timestamp in the list to open a search using the clicked content.
For example, clicking on the /opt/splunk/var/log/splunk/splunkd.log source value in an event opens the following search in a new window.
* source="/opt/splunk/var/log/splunk/splunkd.log"
| Data structure requirements for visualizations | Table visualization overview |
This documentation applies to the following versions of Splunk® Enterprise: 8.2.0, 8.2.1, 8.2.2, 8.2.3, 8.2.4, 8.2.5, 8.2.6, 8.2.7, 8.2.8, 8.2.9, 8.2.10, 8.2.11, 8.2.12, 9.0.0, 9.0.1, 9.0.2, 9.0.3, 9.0.4, 9.0.5, 9.0.6, 9.0.7, 9.0.8, 9.0.9, 9.0.10, 9.1.0, 9.1.1, 9.1.2, 9.1.3, 9.1.4, 9.1.5, 9.1.6, 9.1.7, 9.1.8, 9.1.9, 9.2.0, 9.2.1, 9.2.2, 9.2.3, 9.2.4, 9.2.5, 9.2.6, 9.3.0, 9.3.1, 9.3.2, 9.3.3, 9.3.4, 9.4.0, 9.4.1, 9.4.2

 Download manual
Feedback submitted, thanks!