Create multiple views with tabs
Creating multiple views using tabs in your dashboard visual editor helps organize and categorize your data. By putting different charts in different tab views, you can tailor your dashboard to specific needs without cluttering a single view.
By default, any new or existing dashboard starts with 1 tab that you can see in Edit mode. Searches only run when you navigate to a tab and select it, unless the search powers a search-based token. While viewing a dashboard during a given session, previously viewed tabs cache their searches for the next viewing.
Add, remove, or reorder tabs
You can add, remove, or reorder tabs using the tab bar. You can also reorder tabs by dragging and dropping them. Additionally, you can use a keyboard shortcut by selecting Shift+F10 and arrow keys to navigate across tabs.
The following image shows the tab bar UI for adding, removing, and reordering tabs.
Rename tabs or change the layout
To rename a tab, follow these steps:
- Select the tab you want to rename
- Navigate to the Configuration panel and select the tab section
- Change the tab's name in the Tab name field
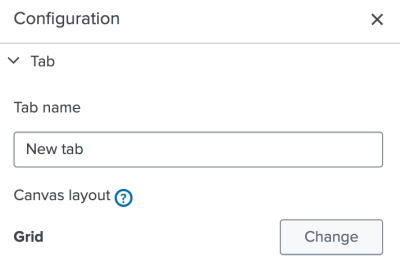
In the Configuration panel, select the Change button to modify the tab's layout from Grid to Absolute. By default, all new tabs start in Grid layout. Tabs can only change from Grid to Absolute.
The following image shows the configuration panel for renaming a tab and changing its layout.
Clone visualizations between tabs
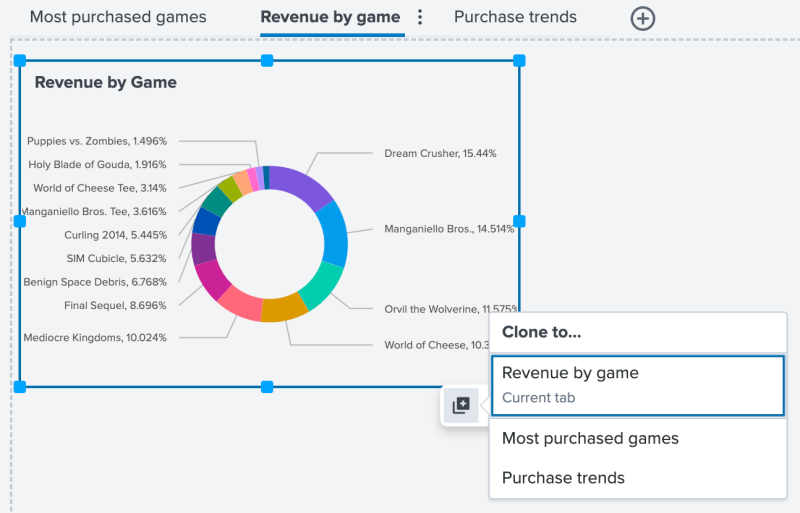
Select a visualization's action panel clone a visualization between tabs. The following image shows the action panel UI for cloning a visualization to a different tab.
Dashboard definition structure
In the layout section of the dashboard definition, a subsection called tabs provides the layoutId and label for each tab in a dashboard. You can copy and paste any valid JSON legacy source code into a dashboard definition, and the source code will migrate to the structure with the tabs section. The copied JSON must be the entire dashboard definition and cannot be only portions of the dashboard definition.
Opening a legacy dashboard updates the dashboard definition to the structure with the tabs section. A Save button activates when a dashboard definition migrates to the updated structure.
Source code example of a dashboard with tabs
Select Expand to see the dashboard definition of a dashboard with tabs. Notice the layout section and the tabs subsection:
{
   "visualizations": {
       "viz_xrbz6Brd": {
           "type": "splunk.table",
           "dataSources": {
               "primary": "ds_most_purchased_games"
           },
           "title": "Most Purchased Games",
           "options": {
               "count": 8,
               "backgroundColor": "transparent",
               "tableFormat": {
                   "rowBackgroundColors": "> table | seriesByIndex(0) | pick(tableAltRowBackgroundColorsByBackgroundColor)",
                   "headerBackgroundColor": "> backgroundColor | setColorChannel(tableHeaderBackgroundColorConfig)",
                   "rowColors": "> rowBackgroundColors | maxContrast(tableRowColorMaxContrast)",
                   "headerColor": "> headerBackgroundColor | maxContrast(tableRowColorMaxContrast)"
               }
           }
       },
       "viz_totalRevenue": {
           "type": "splunk.singlevalue",
           "options": {
               "backgroundColor": "transparent"
           },
           "dataSources": {
               "primary": "ds_total_revenue"
           }
       },
       "viz_3a0RwTBs": {
           "type": "splunk.markdown",
           "options": {
               "markdown": "### Total Revenue"
           }
       },
       "viz_jEkEMFON": {
           "type": "splunk.pie",
           "dataSources": {
               "primary": "ds_eDxW9LZa_ds_revenue_by_game"
           },
           "title": "Revenue by Game",
           "options": {
               "showDonutHole": true,
               "labelDisplay": "valuesAndPercentage",
               "backgroundColor": "transparent"
           }
       },
       "viz_Mrfg9BvV": {
           "type": "splunk.column",
           "dataSources": {
               "primary": "ds_XKEvq0XM_ds_purchase_trends"
           },
           "title": "Purchase Trends",
           "options": {
               "backgroundColor": "transparent",
               "stackMode": "stacked",
               "legendDisplay": "bottom"
           }
       }
   },
   "dataSources": {
       "ds_most_purchased_games": {
           "type": "ds.search",
           "options": {
               "query": "index=main sourcetype=access_* action=purchase status=200 \n| stats count as Purchases by productName price\n| table productName Purchases price\n| eval Revenue=Purchases*price\n| table productName Purchases Revenue\n| sort -Purchases | rename productName as \"Game\"\n| head 8"
           },
           "name": "Most Purchased Games"
       },
       "ds_revenue_by_game": {
           "type": "ds.search",
           "options": {
               "query": "index=main sourcetype=access_* action=purchase status=200 \n| stats count values(price) as Price by productName productId \n| table productName productId count Price\n| eval revenue=count*Price \n| fields productName revenue\n| rename productName as \"Game\" revenue as \"Revenue\" \n| sort -Revenue"
           },
           "name": "Revenue by Game"
       },
       "ds_purchase_trends": {
           "type": "ds.search",
           "options": {
               "query": "index=main sourcetype=access_* status=200 action=purchase \n| fields _time categoryId clientip\n| timechart count by categoryId"
           },
           "name": "Purchase Trends"
       },
       "ds_total_revenue": {
           "type": "ds.chain",
           "options": {
               "extend": "ds_revenue_by_game",
               "query": "| stats sum(Revenue) as \"Total Revenue\""
           },
           "name": "Total Revenue"
       },
       "ds_eDxW9LZa_ds_revenue_by_game": {
           "type": "ds.search",
           "options": {
               "query": "index=main sourcetype=access_* action=purchase status=200 \n| stats count values(price) as Price by productName productId \n| table productName productId count Price\n| eval revenue=count*Price \n| fields productName revenue\n| rename productName as \"Game\" revenue as \"Revenue\" \n| sort -Revenue"
           },
           "name": "Revenue by Game copy 1"
       },
       "ds_XKEvq0XM_ds_purchase_trends": {
           "type": "ds.search",
           "options": {
               "query": "index=main sourcetype=access_* status=200 action=purchase \n| fields _time categoryId clientip\n| timechart count by categoryId"
           },
           "name": "Purchase Trends copy 1"
       }
   },
   "defaults": {
       "dataSources": {
           "ds.search": {
               "options": {
                   "queryParameters": {
                       "latest": "$global_time.latest$",
                       "earliest": "$global_time.earliest$"
                   }
               }
           }
       }
   },
   "inputs": {
       "input_global_trp": {
           "type": "input.timerange",
           "options": {
               "token": "global_time",
               "defaultValue": "2022-06-01T23:00:00.000Z,2022-06-09T17:33:53.088Z"
           },
           "title": "Global Time Range"
       }
   },
   "description": "Dashboard Studio tabs",
   "title": "Buttercup Games Online Store",
   "layout": {
       "tabs": {
           "items": [
               {
                   "layoutId": "layout_1",
                   "label": "Most purchased games"
               },
               {
                   "layoutId": "layout_5iyDUo5T",
                   "label": "Revenue by game"
               },
               {
                   "layoutId": "layout_FtuMMSgO",
                   "label": "Purchase trends"
               }
           ]
       },
       "layoutDefinitions": {
           "layout_1": {
               "type": "absolute",
               "options": {
                   "display": "auto-scale",
                   "width": 1300,
                   "height": 700,
                   "backgroundImage": {
                       "sizeType": "cover",
                       "x": 0,
                       "y": 0,
                       "src": "splunk-enterprise-kvstore://62b5f4888b912276916d83e7"
                   }
               },
               "structure": [
                   {
                       "item": "viz_xrbz6Brd",
                       "type": "block",
                       "position": {
                           "x": 10,
                           "y": 20,
                           "w": 460,
                           "h": 300
                       }
                   },
                   {
                       "item": "viz_totalRevenue",
                       "type": "block",
                       "position": {
                           "x": 540,
                           "y": 10,
                           "w": 230,
                           "h": 200
                       }
                   },
                   {
                       "item": "viz_3a0RwTBs",
                       "type": "block",
                       "position": {
                           "x": 600,
                           "y": 30,
                           "w": 120,
                           "h": 40
                       }
                   }
               ]
           },
           "layout_5iyDUo5T": {
               "type": "absolute",
               "structure": [
                   {
                       "item": "viz_jEkEMFON",
                       "type": "block",
                       "position": {
                           "x": 10,
                           "y": 20,
                           "w": 670,
                           "h": 390
                       }
                   }
               ]
           },
           "layout_FtuMMSgO": {
               "type": "grid",
               "structure": [
                   {
                       "item": "viz_Mrfg9BvV",
                       "type": "block",
                       "position": {
                           "x": 0,
                           "y": 0,
                           "w": 1200,
                           "h": 400
                       }
                   }
               ]
           }
       },
       "globalInputs": [
           "input_global_trp"
       ],
       "options": {
           "showTitleAndDescription": false
       }
   }
}
Limitations for Dashboard Studio tabs
The following lists the limitations of the dashboard tabs:
- Scheduled email exports only include the first tab in the dashboard.
- Downloading a PDF or PNG of a dashboard only includes the selected tab.
- When using a real-time base search attached to one visualization and then using that same base search in a chain search in a second visualization, removing the first visualization from the dashboard will pause the second visualization's chain search.
- If a real-time base search is in one tab, and a chain search is in a different tab, the base search pauses when another tab is selected.
- Searches that power search-based tokens always run even if their associated tab is not selected.
- Adding a visualization from the Search page to a dashboard with the Save to modals results in the visualization on the first tab. You cannot specify which tab to add the visualization.
| Set up a dashboard | Source code editor |
This documentation applies to the following versions of Splunk® Enterprise: 9.4.0, 9.4.1


 Download manual
Feedback submitted, thanks!