What is the visual editor?
You can create and update dashboards in the visual editor. The editing toolbar in the visual editor provides visualizations to add to a dashboard, ways to create a data source, and access to the source code editor for more advanced customization. See the changes you make in the dashboard canvas and adjust the dashboard elements in the configuration panel. The configuration panel changes functionality depending on what element of the dashboard you select.
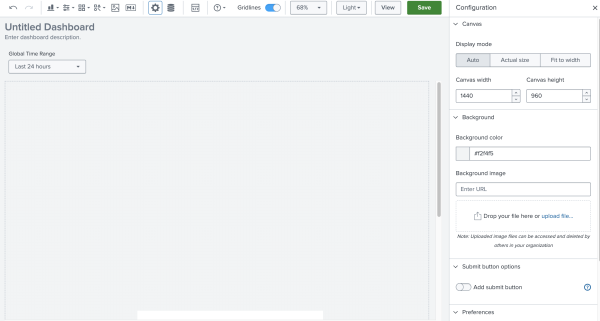
The following is a screenshot of the visual editor using absolute mode.
Use the following table as a reference for all tools in the editing toolbar:
Edit mode visualization panel actions
When you select a chart or shape, an action panel appears to the right of the object. Use this panel to layer, clone, delete, or download an image of the object.
Layer objects
To move the object through the different layers of your canvas, click the layering icon shown in the following image:
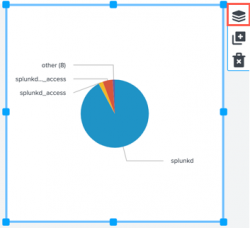
The number of available options depends on the layer of your object. For example, if your object is on the top layer of the canvas, you can send your object back one layer, or to the first layer of the canvas. If your object is in a middle layer, you have four options:
- To send your object forward one layer, select Move forward.
- To send your object to the front layer, select Bring to front.
- To send your object back one layer, select Move backward.
- To send your object to the back to the first layer, select Send to back.
Clone an object
To clone the selected object, click the clone icon.
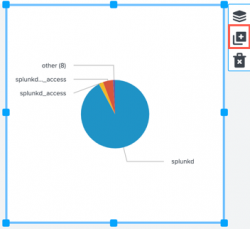
If you clone an object that is connected to a data source, you can use the Configuration panel to choose an existing data source, or create a new one.
Delete an object
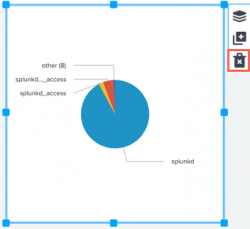
To delete the selected object, click the delete icon:
Access visualization source code
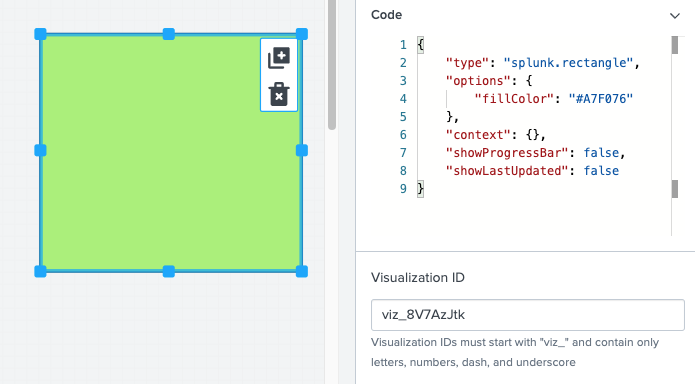
You can modify the source code of a visualization or data source in the visual editor by selecting the visualization or search and opening the code window in the Configuration panel. The changes you make will instantly affect the visualization or data source you're working with. For example:
View mode visualization panel actions
In the dashboard view mode, users can interact with a visualization by selecting it to open an action menu. Upon selecting the visualization, a menu appears in a panel at the top right corner of the visualization. The following options are available:
Open in search
Users with admin permissions can click the magnifying glass on a selected visualization to open the search driving the visualization in Search.
Expand the visualization
Click the full screen icon to view the visualization panel in full screen mode. Press the escape (esc) key to exit full screen mode.
Refresh the search driving the visualization
Click the refresh icon to refresh the visualization.
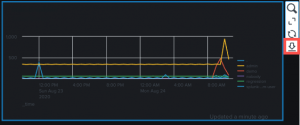
Download a visualization
Click the download icon to download individual visualizations in PNG format.
| Part 11 Polish up your dashboard | Set up a dashboard |
This documentation applies to the following versions of Splunk Cloud Platform™: 9.0.2305, 8.2.2201, 8.2.2202, 8.2.2203, 9.0.2205, 9.0.2208, 9.0.2209, 9.0.2303
 Download manual
Feedback submitted, thanks!