Create search-based visualizations with ds.search
The data source type ds.search is used for ad hoc searches that you create in the visual editor. If you want to use a saved search, see Use reports and saved searches with ds.savedSearch.
You can specify the time range for your data sources using either the Dashboard Studio UI or by directly updating the source code.
When editing a data source with the UI, you can choose to use the following:
- Any time range input on the page.
- A static time range. For example, the last seven days, regardless of other input selections.
- The dashboard default.
When editing the data source in the source code, the ds.search data source is assigned a unique ID when you create a search string in the Configuration panel. You can find the associated source code stanza by locating the unique ID. The stanza contains the data source type and any options you have made available.
The only option that must return events is the query option, which is an SPL search.
For example, the following data source uses the search
index=_internal | head 500
to return results that can be displayed by adding the ID of the data source, "ds_BCsearch", to a visualization module as its primary data source.
{
"dataSources": {
	"ds_BCsearch": {
		"type": "ds.search",
		"options": {
			"query": "index=_internal | head 500",
			"queryParameters": {
				"earliest": "0",
				"latest": "now"
			}
               }
     }
The following is an example of a visualization using ds_BCsearch as the primary dataSource .
{
"visualizations": {
	"viz_AHAavFGS": {
		"type": "splunk.table",
		"options": {
			"backgroundColor": "#0000FF",
                               "fontColor": "#0000FF"
		},
		"dataSources": {
			"primary": "ds_BCsearch"
		}
	}
The visualization must also appear in the layout. The following is a complete dashboard example using the two stanzas above.
{
"dataSources": {
	"BCsearch": {
		"type": "ds.search",
		"options": {
			"query": "index=_internal | head 500",
			"queryParameters": {
				"earliest": "0",
				"latest": ""
			}
		}
	}
},
"visualizations": {
	"viz_Example": {
		"type": "splunk.table",
		"options": {},
		"dataSources": {
			"primary": "BCsearch"
		}
	}
},
"inputs": {},
"layout": {
	"globalInputs": [],
	"type": "absolute",
	"options": {
		"width": 1801
	},
	"structure": [
		{
			"item": "viz_Example",
			"type": "block",
			"position": {
				"x": 10,
				"y": 50,
				"w": 1270,
				"h": 600
			}
		}
	]
},
"description": "",
"title": "Example",
"defaults": {
	"visualizations": {
		"global": {
			"showLastUpdated": true
		  }
	    }
       }
}
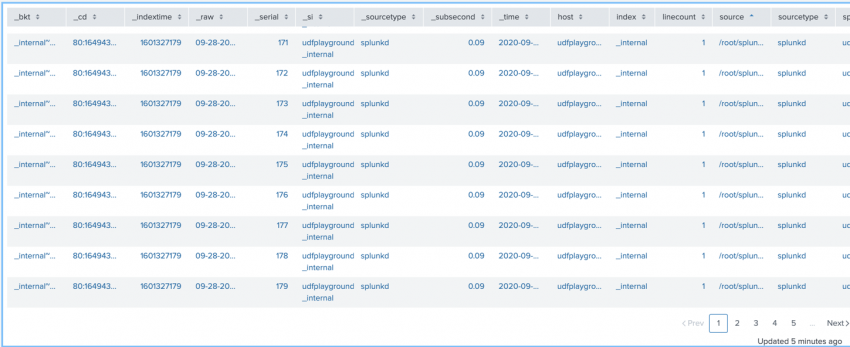
The resulting table visualization looks similar to this:
If you are using lookups in your search, make sure the lookup permissions are set to "global".
Modify the time range for a data source
By default all data sources that power visualizations on a dashboard are controlled by the default Global Time Range Picker. You can use the source editor to modify set time ranges for individual data source stanzas and override the Global Time Range Picker. Because it's an input, you can also delete or modify the default Global Time Range Picker in the source editor. To learn how to use data source options that affect the time range, for example, queryParameters, see Data source options. To read more about the time range picker, see Time range.
Limitations to search based dashboards
Dashboards with many searches and exceeding 7,000 characters in the Uniform Resource Identifier (URI) do not consistently load and might remain in a "waiting on data" state. A large URI might exceed the limit of various server software used with the Splunk platform, such as NGINX.
| What is a dashboard definition? | Chain searches together with a base search and chain searches |
This documentation applies to the following versions of Splunk Cloud Platform™: 9.2.2403, 8.2.2202, 8.2.2203, 8.2.2201, 9.0.2205, 9.0.2208, 9.0.2209, 9.0.2303, 9.0.2305, 9.1.2308, 9.1.2312

 Download manual
Feedback submitted, thanks!