Dashboard overview
The Splunk App for Enterprise Security provides a wide range of dashboards, each of which gives you a different lens into your security-related data - from a high-level overview of all security threats on your system, through summary and search dashboards for each of three security domains, down to the details of the operation and configuration of the Splunk App for Enterprise Security.
Security Posture and Incident Review dashboards
Two dashboards provide a high-level view of your deployment. These dashboards use notable events, aggregated events that identify patterns or security issues that may require investigation. Notable events are generated by real-time or scheduled searches called correlation searches. Initially, you will not see any content in these dashboards; content will appear when the underlying correlation searches have completed.
- Security Posture: "Are things OK?" The primary Enterprise Security dashboard. This provides a high-level visual summary and trend indication of the notable events across all of your deployment in the past 24 hours. This dashboard is continuously updated by real-time searches.
- Incident Review: "What should we do now?" Shows the details of all notable events identified within your deployment. From this dashboard you can monitor notable event activity, filter events by criteria such as urgency or domain, or manage the status of the notable events.
Domain dashboards
The domain dashboards give visibility into the three primary domains of security: Access protection, Endpoint protection, and Network protection, and provide the following functionality:
- Access: Provides information about authentication attempts and access control related events (login, logout, access allowed, access failure, use of default accounts, and so on).
- Endpoint: Includes information about endpoints such as malware infections, system configuration, system state (CPU usage, open ports, uptime, and so on), patch status and history (which updates have been applied) and time synchronization information.
- Network: Includes information about network traffic provided from devices such as firewalls, routers, network-based intrusion detection systems, network vulnerability scanners, proxy servers, and hosts.
Each domain includes summary dashboards that give an overview of important security areas along with search dashboards that allow you to drill down into more detailed information. Dashboards are categorized as centers, profilers, or search dashboards.
- Centers (for example, "Malware Center", "Asset Center", and so on): Provide an overview of the security events for a given domain. These overview dashboards identify significant trends or show relevant issues that may require attention.
- Profilers (for example, "Patch / Update Profiler", "Vulnerability Profiler"): Provide information about a particular user or object. For example, the patch /update profiler provides information about which devices have been updated with a particular patch or software update.
- Analysis (for example, "Traffic Size Analysis", "HTTP User Agent Analysis"): Provide statistical information about data and events being monitored. Using a variety of custom filters, you can locate and identify anomalous events to investigate.
- Search dashboards (for example, "Proxy Search", "Vulnerability Search"): Search dashboards provide rapid access to domain-specific search tools, without requiring advanced knowledge of the Splunk search language.
Some Splunk App for Enterprise Security dashboard panels are populated by saved searches or time-independent searches.
This behavior applies these dashboard panels:
- Access Center > Notable Access Events (saved search)
- Malware Center > Key Malware Statistics (time-independent)
- Traffic Center > Port and Protocol Profiler (saved search)
For informational purposes, these panels ignore top-level filters.
Supporting dashboards
Additional Splunk App for Enterprise Security dashboards help monitor and investigate the security of the infrastructure. These dashboards provide the following functionality:
- Identity: Review identities associated with the network and their associated activities. Also review asset lists and see a summary of all network sessions. (To get optimal functionality from Enterprise Security, create or import an asset list and an identities list associated with the network. See the Enterprise Security Installation and Configuration Manual for more information.)
- Audit (for example, "Incident Review Audit", "Suppression Audit", "Forwarder Audit", "Index Audit", and so on): Provide information about Splunk's own operational data including: forwarder auditing, index auditing, search auditing, and data protection. Use this dashboard to track resource consumption, organizational activity, and analyst effectiveness. These are potentially critical components to a security organization.
- Resources: This menu links to additional resources related to Splunk and to data security, including: generic Splunk search capability and a view of the Splunk indexes. This menu also includes Threat Intelligence, which provides direct links to security resources on the web.
Tags
The Splunk App for Enterprise Security uses tags to categorize data. For example, anti-virus data is tagged as 'malware' and 'attack' to denote a malware attack. Tagging the data makes it possible for all events that are malware-related to be identified, regardless of the log message format or vendor.
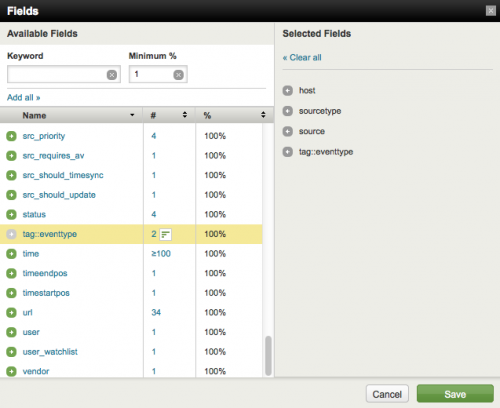
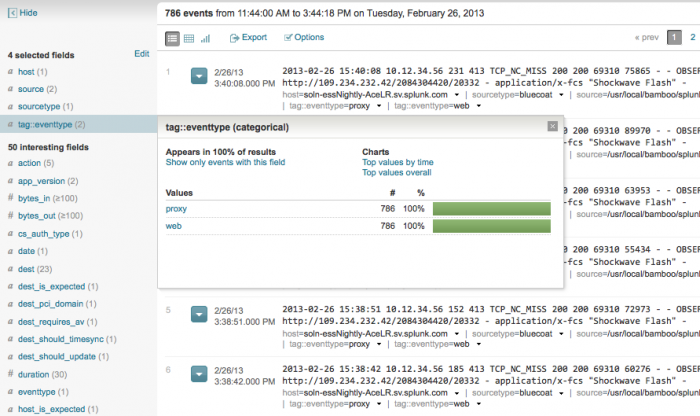
View the tags for specific events by displaying the eventtype and tag::eventtype fields in the search dashboard.
To do this:
1. Search for an event type:
eventtype="bluecoat""
2. Locate the list of fields on the left side of the search dashboard. Click "View all fields" at the bottom of the list.
Note: If this area is blank, run a search or to show the list by clicking on the greater than symbol.
3. Click the field tag::eventtype in the Field Selector.
4. Click Save. The tags now show up at the bottom of each event after a search.
The Common Information Model
The Splunk Common Information Model (CIM) is a system for categorizing data from different sources and across different domains. This information is contained as data models in the Common Information Add-on. See the Common Information Add-on Manual for more information. The Splunk App for Enterprise Security uses an extended version of the Common Information Model to normalize IT security data, incorporate it in the dashboards, and correlate across different source types and domains.
Whenever data source types are added to the Splunk App for Enterprise Security, ensure that the data is processed according to the CIM as described in the Data Source Integration Manual.
| Notable events and incident workflow | Enterprise Security Home |
This documentation applies to the following versions of Splunk® Enterprise Security: 3.0, 3.0.1


 Download manual
Feedback submitted, thanks!