Resources dashboards
The Resources menu provides additional information and links to external security resources.
Event Geography dashboard
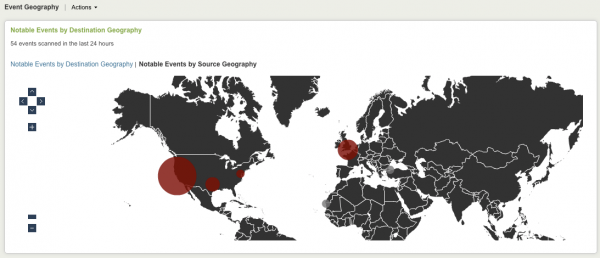
The Event Geography dashboard aggregates available geographic information for notable events across all domains. You can choose to view the location by target or by source geography. This panel is useful for comparing the number of incidents based on geographical region.
This dashboard is disabled by default. To enable it, go to Configure > Dashboards/Domains and click the Event Geography box. Save the configuration.
Only those notable events with geographic location appear in this panel; notable events that are aggregates of multiple events do not appear because these types of events rarely have a single location.
Click on a red circle to see notable events associated with that location. Click the arrows at the left of the screen to scroll up and down the map. Click the + and - buttons to enlarge or reduce the view.
Note: Configure geographic location for assets in the Asset table. See the Installation and Configuration Manual for more information.
Common Information Model
The Overview links to "Understand and use the Common Information Model" in the Knowledge Manager Manual in the core Splunk product documentation.
Eventtype and Tags Center
The Eventtypes and Tags Center can display the event types and tags present in your environment. The dashboard will not work when the Splunk App for Enterprise Security is first installed, because the 'CIM - Eventtype And Tag Count - Summary Gen' search that populates the dashboard is disabled by default.
This correlation search is memory intensive and may slow down your Enterprise Security instance if enabled.
To enable this correlation search:
- Go to Manager > Searches and Reports and find the search you want to enable (
CIM - Eventtype And Tag Count - Summary Gen). - Click Enable.
- Click Back to Enterprise Security.
When the CIM - Eventtype And Tag Count - Summary Gen search has been enabled, the summary of event types and tags will be displayed.
Deployment Application overview
This resource menu item links to the Splunk deployment server in the Splunk App for Enterprise Security Installation and Configuration Manual for information about using the deployment server.
Threat intelligence
This menu provides links to internet sources for up-to-date information about security threats. These sources are:
- Project Honeypot: distributed system for identifying spammers and the spambots, tracks and stops email harvesters
- US-CERT (United States Computer Emergency Readiness Team) - List of Notes by Date Published: national agency to improve cybersecurity posture, coordinate cyber information sharing, and proactively manage cyber risks to the nation
- Virus Bulletin: covers the global virus threat landscape
- Wildlist: cooperative listing of viruses reported as being in the wild by virus information professionals
Use information from these websites to update network malware recognition for your Enterprise Security deployment.
To add additional resources to this list, see "Configure blocklists" in the Splunk App for Enterprise Security Installation and Configuration Manual.
Search
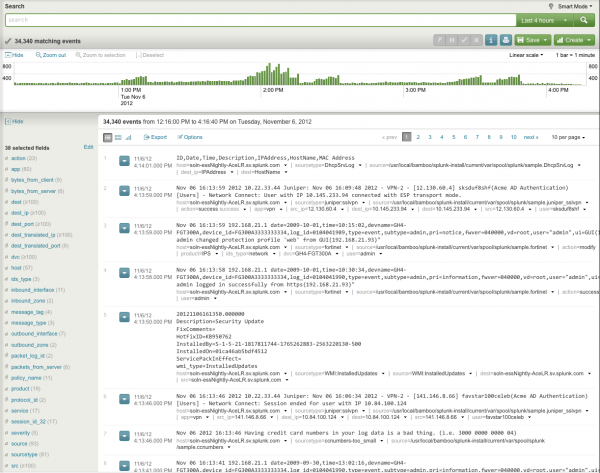
The Search dashboard is a separate menu item. It is a free-form Splunk Search dashboard inside the Splunk App for Enterprise Security. In addition to all the features of the regular Splunk Search dashboard, this dashboard provides workflow actions to drill down from fields in Enterprise Security domains, as well as access external resources.
Note: Text values in the filters must be lowercase text.
See "Use workflow actions" in this manual for more information.
| Additional Network dashboards | Advanced Filter |
This documentation applies to the following versions of Splunk® Enterprise Security: 3.0, 3.0.1


 Download manual
Feedback submitted, thanks!