Part 5: Review risk notables for triaging
Now, you can review some risk notables that gets generated by the default risk incident rules in Splunk Enterprise Security. Reviewing risk notables by drilling down on them using the Risk Event Timeline visualizations helps to triage and identify the risk notables that require further investigation.
Following are the default risk incident rules available in Splunk Enterprise Security:
- Att&CK Tactic Threshold Exceeded For Object Over Previous 7 days
- Risk Threshold Exceeded For Object Over 24 Hour Period
Review risk notables
Follow these steps to review risk notables generated by the default risk incident rules available in Splunk Enterprise Security:
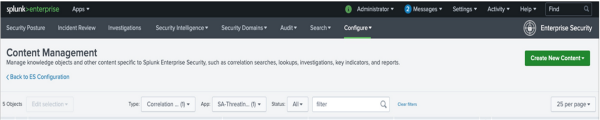
- In Splunk Enterprise Security, select Configure, then select Content.
- Select Content Management.
- In Type, select Correlation Search.
- In App, select SA-ThreatIntelligence.
- Select the default risk incident rule Risk Threshold Exceeded For Object Over 24 Hour Period to open it in the Correlation Search Editor.
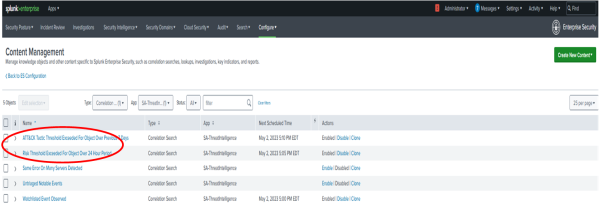
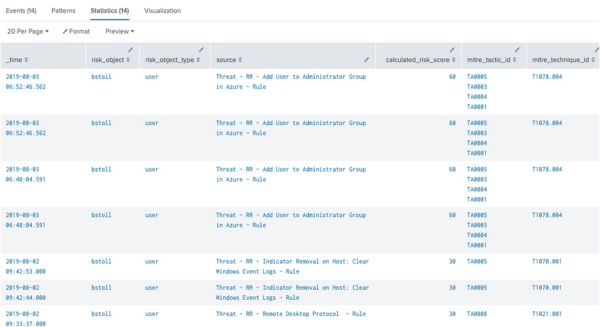
- From the Correlation Search Editor, copy the SPL search associated with this risk incident rule and paste it in the Search bar to review the results.
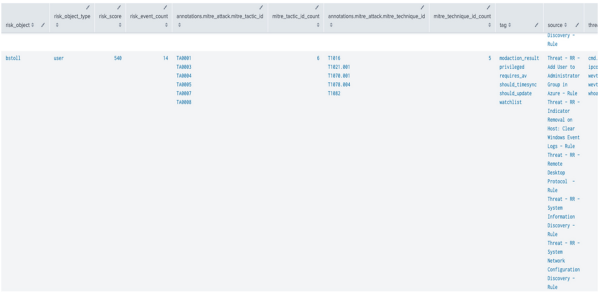
| tstats `summariesonly` mode(All_Risk.risk_object) as risk_object, sum(All_Risk.calculated_risk_score) as risk_score, count(All_Risk.calculated_risk_score) as risk_event_count,values(All_Risk.annotations.mitre_attack.mitre_tactic_id) as annotations.mitre_attack.mitre_tactic_id, dc(All_Risk.annotations.mitre_attack.mitre_tactic_id) as mitre_tactic_id_count, values(All_Risk.annotations.mitre_attack.mitre_technique_id) as annotations.mitre_attack.mitre_technique_id, dc(All_Risk.annotations.mitre_attack.mitre_technique_id) as mitre_technique_id_count, values(All_Risk.tag) as tag, values(source) as source, dc(source) as source_count, values(All_Risk.risk_object) as all_risk_objects, values(All_Risk.cim_entity_zone) as cim_entity_zone from datamodel=Risk.All_Risk by All_Risk.normalized_risk_object,All_Risk.risk_object_type | `drop_dm_object_name("All_Risk")` | eval "annotations.mitre_attack"='annotations.mitre_attack.mitre_technique_id', risk_threshold=100 | where risk_score > $risk_threshold$ | `get_risk_severity(risk_score)`You might find a few risk objects that might be worth investigating further due to their high risk score, risk event count, and the number of MITRE tactics associated with them.


Use Incident Review for additional context to triage incidents effectively
Follow these steps to triage incidents using the Incident Review page:
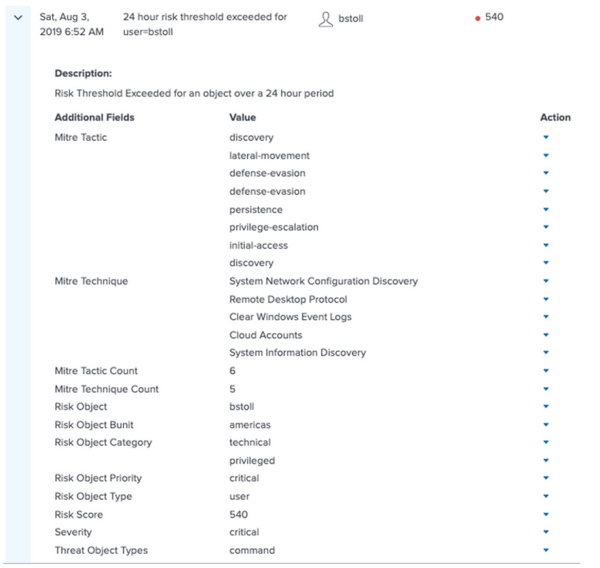
- In Splunk Enterprise Security, select Incident Review to display the list of risk notables.
- Expand the risk notable for additional context such as MITRE tactic and technique, associated risk objects, risk object priority, and risk score, and so on.
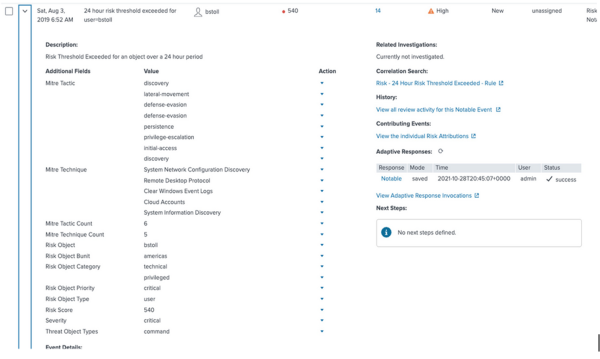
- Under Contributing Events, select View the individual Risk Attributions to drill down into the risk index.
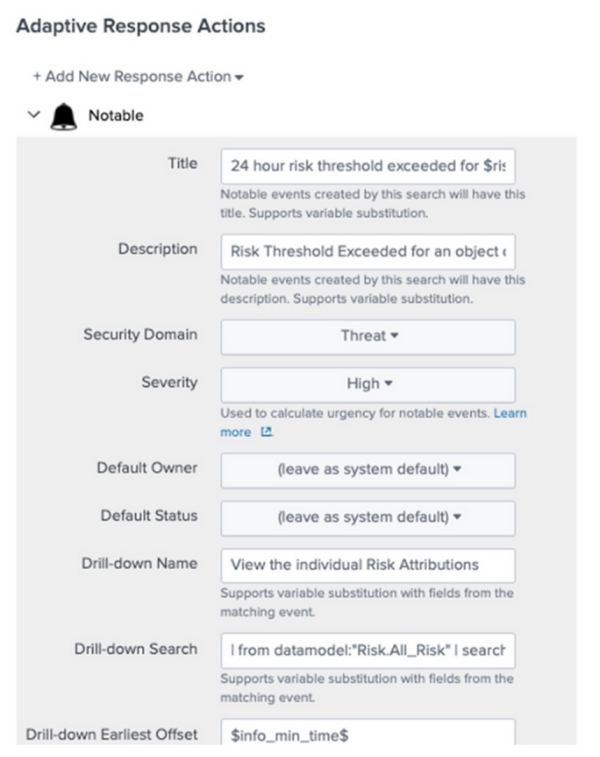
If you want to display additional context, you can add more columns to search the risk index by modifying the drill-down search in the '''Adaptive Response Action''' of the Correlation Search Editor.
 Following is an example of what the search results look like with the improved drill-down:
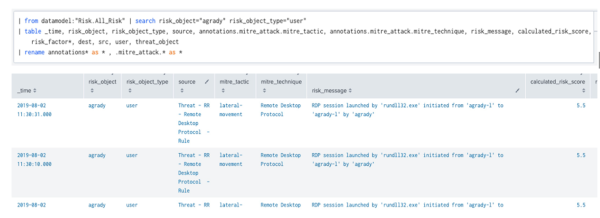 The risk message in the table provides additional information that might be helpful for triaging.


Use the Risk Event timeline to drill down on risk events
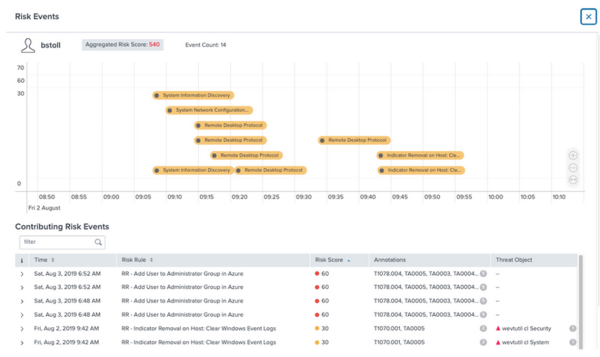
Now, you can explore the risk notables generated by the default risk incident rule in the Risk Event Timeline visualization and sort them by time to review threat objects.
Follow these steps to examine the risk notables using the Risk Event Timeline:
- In Splunk Enterprise Security, go to Incident Review and select the drop down arrow next to the risk object in the Actions column.
- Select Risk Event Timeline.
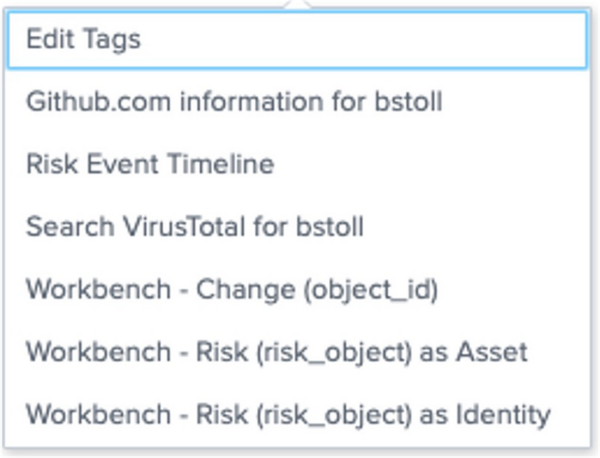
- Review the timeline visualization to sort the contributing risk events by time and review the associated threat objects.


See also
For more information on the Risk Event Timeline visualization, see the product documentation:
- Default risk incident rules in Splunk Enterprise Security
- Review risk notables to identify risk in Splunk Enterprise Security
Next step
Now that you have reviewed a risk notable that might indicate threat, you can explore how to Suppress risk notables that are harmless.
| Part 4: Review risk using the Risk Analysis dashboard | Part 6: Suppress risk notables to reduce alert noise |
This documentation applies to the following versions of Splunk® Enterprise Security: 7.2.0, 7.3.0, 7.3.1, 7.3.2, 7.3.3
Feedback submitted, thanks!