Customize table settings for the analyst queue in Splunk Enterprise Security
Customize table settings in the Analyst queue to display the fields for findings.
Follow these steps to display specific fields for a finding in the Analyst queue' table on the Mission Control page:
- In the Splunk Enterprise Security app, go to the Mission Control page.
- Select the gear icon to open the Table Settings dialog.
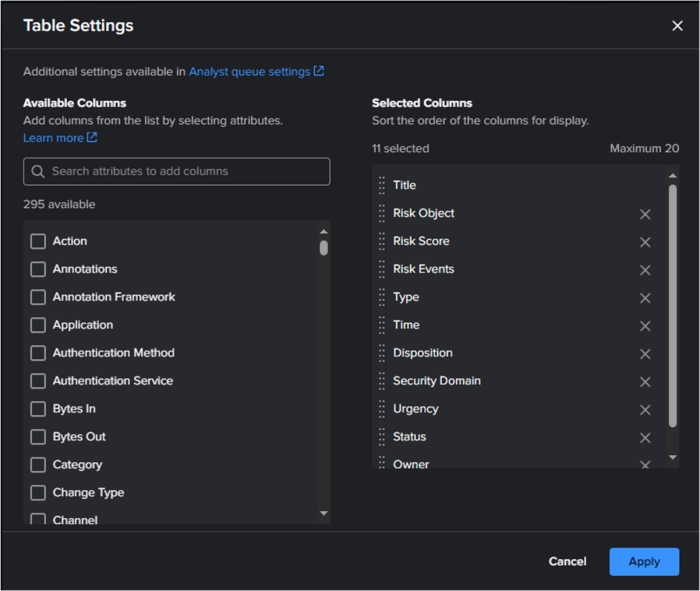
- Select the fields that you want to display in the Analyst queue table on the Mission Control page from the Available Columns. The fields you select get displayed in the Selected Columns.
- (optional)Reorder the selected fields in the Selected Columns based on the order in which you want them to display.
- Select Apply to apply your changes to the table.
The following screenshot shows how you can use the Table Settings to specify the fields that you want to display for a finding on the Mission Control page:
| Manage saved views to display findings and investigations in Splunk Enterprise Security | Use detections to search for threats in Splunk Enterprise Security |
This documentation applies to the following versions of Splunk® Enterprise Security: 8.0.0, 8.0.1, 8.0.2, 8.0.3, 8.0.31, 8.0.40

 Download manual
Feedback submitted, thanks!