Configure KPI thresholds in ITSI
Severity-level thresholds determine the current status of your KPI in IT Service Intelligence (ITSI). When KPI values meet or exceed threshold conditions, the KPI status changes, for example, from high to critical. The current status of the KPI is reflected in all views across the product, including service analyzers, glass tables, and deep dives. Therefore, maintain consistent definitions for each severity value so KPI definitions are sustainable and consistent. For example, all KPIs with a critical status in your environment will immediately generate an alert, but a KPI with a high severity is understood as abnormal, but will not yet generate an alert.
ITSI supports two types of KPI severity-level thresholds: aggregate thresholds and per-entity thresholds.
For an overview of the entire KPI creation workflow, see Overview of creating KPIs in ITSI.
Set aggregate thresholds
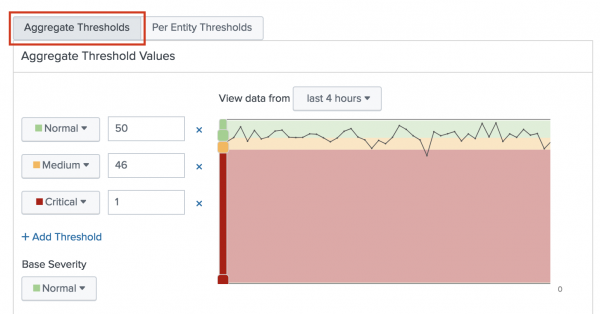
Aggregate thresholds are useful for monitoring the status of aggregated KPI values. For example, you might apply aggregate thresholds to monitor the status of KPIs that return the total number of service requests or service errors, based on a calculation that uses the stats count function.
- Within the KPI creation workflow, click Aggregate Thresholds.
- Click Add threshold to add a range of severity-level thresholds to the threshold preview graph.

- Click Finish.
For information about how KPI importance values affect the overall service health score, see Set KPI importance values in ITSI.
Set per-entity thresholds
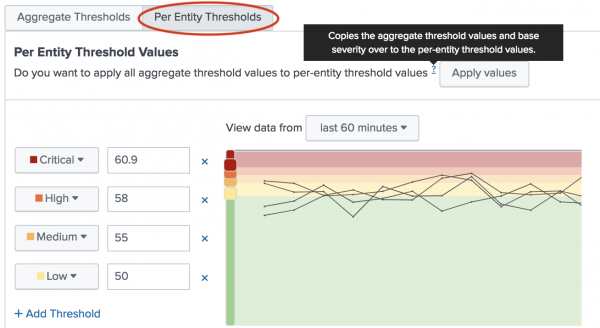
Per-entity thresholds are useful for monitoring multiple, separate entities in a larger environment against which a single KPI is running. For example, you might have a KPI such as Free Memory % that's running against three separate servers. Using per-entity thresholds, you can monitor the status of Free Memory % on each individual server.
Note: To configure per-entity thresholds, the KPI must be split by entity. For more information, see Split and filter a KPI by entities in ITSI.
- Within the KPI creation workflow, click Per-Entity Thresholds.
- Click Add threshold and add a range of severity-level thresholds to the preview graph. The preview shows separate search results for each entity associated with the service.
- Adjust the thresholds to reflect the severity levels to display when the entities exceed certain limits.

- Click Finish.
Advanced thresholding options
Rather than manually configuring threshold values, you can use one of the following advanced options:
- Time-based thresholds - user-defined threshold values to be used at different times of the day or week to account for changing KPI workloads.
- Adaptive thresholds - thresholds calculated by machine learning algorithms that dynamically adapt and change based on the KPI's observed behavior.
For more information, see Overview of advanced thresholding in ITSI.
Next steps
- After you configure KPI thresholds, you can set up alerts to notify you when aggregate KPI severities change. ITSI generates notable events in Episode Review based on the alerting rules you configure. For information, see Receive alerts when KPI severity changes in ITSI.
- Alternatively, you can set up Anomaly Detection for the KPI. Anomaly Detection uses machine learning algorithms to automatically detect abnormalities in KPI behavior and notify you in Episode Review. For more information, see Apply anomaly detection to a KPI in ITSI.
| Enable backfill for a KPI in ITSI | Set KPI importance values in ITSI |
This documentation applies to the following versions of Splunk® IT Service Intelligence: 4.11.0, 4.11.1, 4.11.2, 4.11.3, 4.11.4, 4.11.5, 4.11.6, 4.12.0 Cloud only, 4.12.1 Cloud only, 4.12.2 Cloud only, 4.13.0, 4.13.1, 4.13.2, 4.13.3, 4.14.0 Cloud only, 4.14.1 Cloud only, 4.14.2 Cloud only, 4.15.0, 4.15.1, 4.15.2, 4.15.3, 4.16.0 Cloud only, 4.17.0, 4.17.1
 Download manual
Feedback submitted, thanks!