Scenario: Kai monitors business service degradation and identifies the root cause
The following scenario features Buttercup Games, a fictitious company.
Buttercup Games created a new database that acts as the main data source for their mobile application. Kai, a site reliability engineer at Buttercup Games, uses ITSI Service Insights to monitor how this service affects other services in their environment, and better understand the root cause of increased churn and lower customer satisfaction that they have recently observed. Kai does this by creating a service and tracking two specific key performance indicators (KPIs): the number of database errors, and the database's CPU utilization percentage.
Monitor the health of an IT service with ITSI
ITSI Service Insights allows Kai to create services that represent Buttercup Games' business-critical IT systems and business processes, and monitor the health of these services with KPIs and underlying entities. KPIs are recurring saved searches that return the value of an IT performance metric, and Kai uses the pre-built KPIs in ITSI in order to track common services.
To monitor the health of a service in Splunk ITSI, Kai completes these steps:
- Kai defines entities for the database service in order to send data to the service.
- In ITSI, Kai selects Configuration > Service Templates and creates a new service called
Buttercup Games Databasefrom a Cloud Database service template. This template includes pre-built KPIs that are commonly used to monitor databases.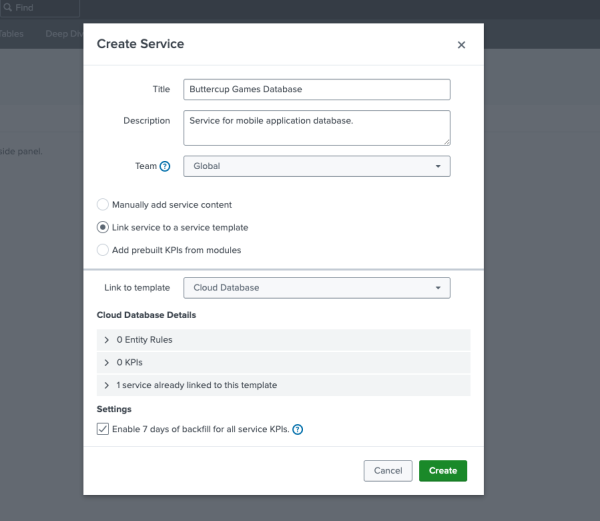
- Kai sets KPI threshold values for the KPIs linked to the service. These values contribute to the service's overall health score, which is a weighted average of the severity levels of a service's KPIs and dependencies. These values also determine when alerts about this service are sent in ITSI.
- Before enabling the service, Kai also sets the KPI called CPU Utilization % at a higher importance value so that this KPI influences the service health score most. Kai also adds Buttercup Games Database as a dependency of Buttercup Games. The following screenshot displays an example of setting these importance values for sample KPIs in ITSI:
- Kai selects Service Analyzer and then the Default Analyzer option to view their new service. The default view displays the service and its health in the context of the rest of the IT environment. By selecting the service, Kai sees the KPI metrics contributing to the service's overall health score and the severity of each KPI.
- Kai sees that the CPU Utilization % KPI for a specific entity is high. In order to investigate what is causing issues with the KPI, Kai opens a deep dive for the service by selecting Open all in Deep Dive.


Diagnose the root cause of performance issues with ITSI deep dives
Kai wants to understand when the CPU utilization percentage increased for the database and what caused the increase. The deep dive is a great tool to identify the point in time that the change in this KPI occurred and how the change correlates with changes in other KPIs, as well as create custom events to monitor similar changes in the future.
To understand the root cause of a service performance issues with deep dives, Kai completes these steps:
- Kai opens a deep dive and hovers over the CPU Utilization % KPI to turn on the Lane Overlay Options option, and enables the entity overlay. The following image shows an example of a deep dive with an entity overlay:

- Kai sees that a different server entity is causing the increase in CPU utilization, and decides to create a multi-KPI alert, which is a type of correlation search, in order to be notified whenever this trend occurs again.
- Kai also sees in the deep dive that the high CPU utilization appears to have similar trends as another KPI that tracks service latency, indicating that there might be some correlation between both KPIs. Kai discovers that these two KPIs are dependencies of another KPI called Customer Service, tracked in a different service. By correlating these KPIs, Kai also creates another multi-KPI alert that generates events when these KPIs reach specific threshold levels.

Summary
In this scenario, Kai:
- Created a service to track the performance health of a new database.
- Create a multi-KPI alert to monitor and detect when the CPU utilization percentage for their service is too high.
Learn more
To learn more about how you can monitor your IT environment with ITSI, see the following topics:
| Subject | Resource |
|---|---|
| Splunk ITSI and Splunk Observability Cloud use case | Scenario: Kai troubleshoots faster with Splunk IT Service Intelligence and Splunk Observability Cloud |
| Services and service templates | |
| KPIs and searches | |
| Deep dives |
| Add tags to a service in ITSI | Overview of the Service Analyzer in ITSI |
This documentation applies to the following versions of Splunk® IT Service Intelligence: 4.11.0, 4.11.1, 4.11.2, 4.11.3, 4.11.4, 4.11.5, 4.11.6, 4.12.0 Cloud only, 4.12.1 Cloud only, 4.12.2 Cloud only, 4.13.0, 4.13.1, 4.13.2, 4.13.3, 4.14.0 Cloud only, 4.14.1 Cloud only, 4.14.2 Cloud only, 4.15.0, 4.15.1, 4.15.2, 4.15.3, 4.16.0 Cloud only, 4.17.0, 4.17.1, 4.18.0, 4.18.1, 4.19.0, 4.19.1, 4.19.2, 4.19.3, 4.19.4, 4.20.0, 4.20.1
Feedback submitted, thanks!