Scenario: Kai troubleshoots faster with IT Service Intelligence and Splunk Observability Cloud 🔗
Online Boutique, a fictitious company that runs an e-commerce site to sell its products, suddenly experiences degraded revenue in online sales. Kai, a site reliability engineer at Online Boutique, uses Splunk IT Service Intelligence and Splunk Observability Cloud together to accelerate troubleshooting.
To troubleshoot the problem, Kai decides to take the following actions:
Check service health in Splunk IT Service Intelligence 🔗
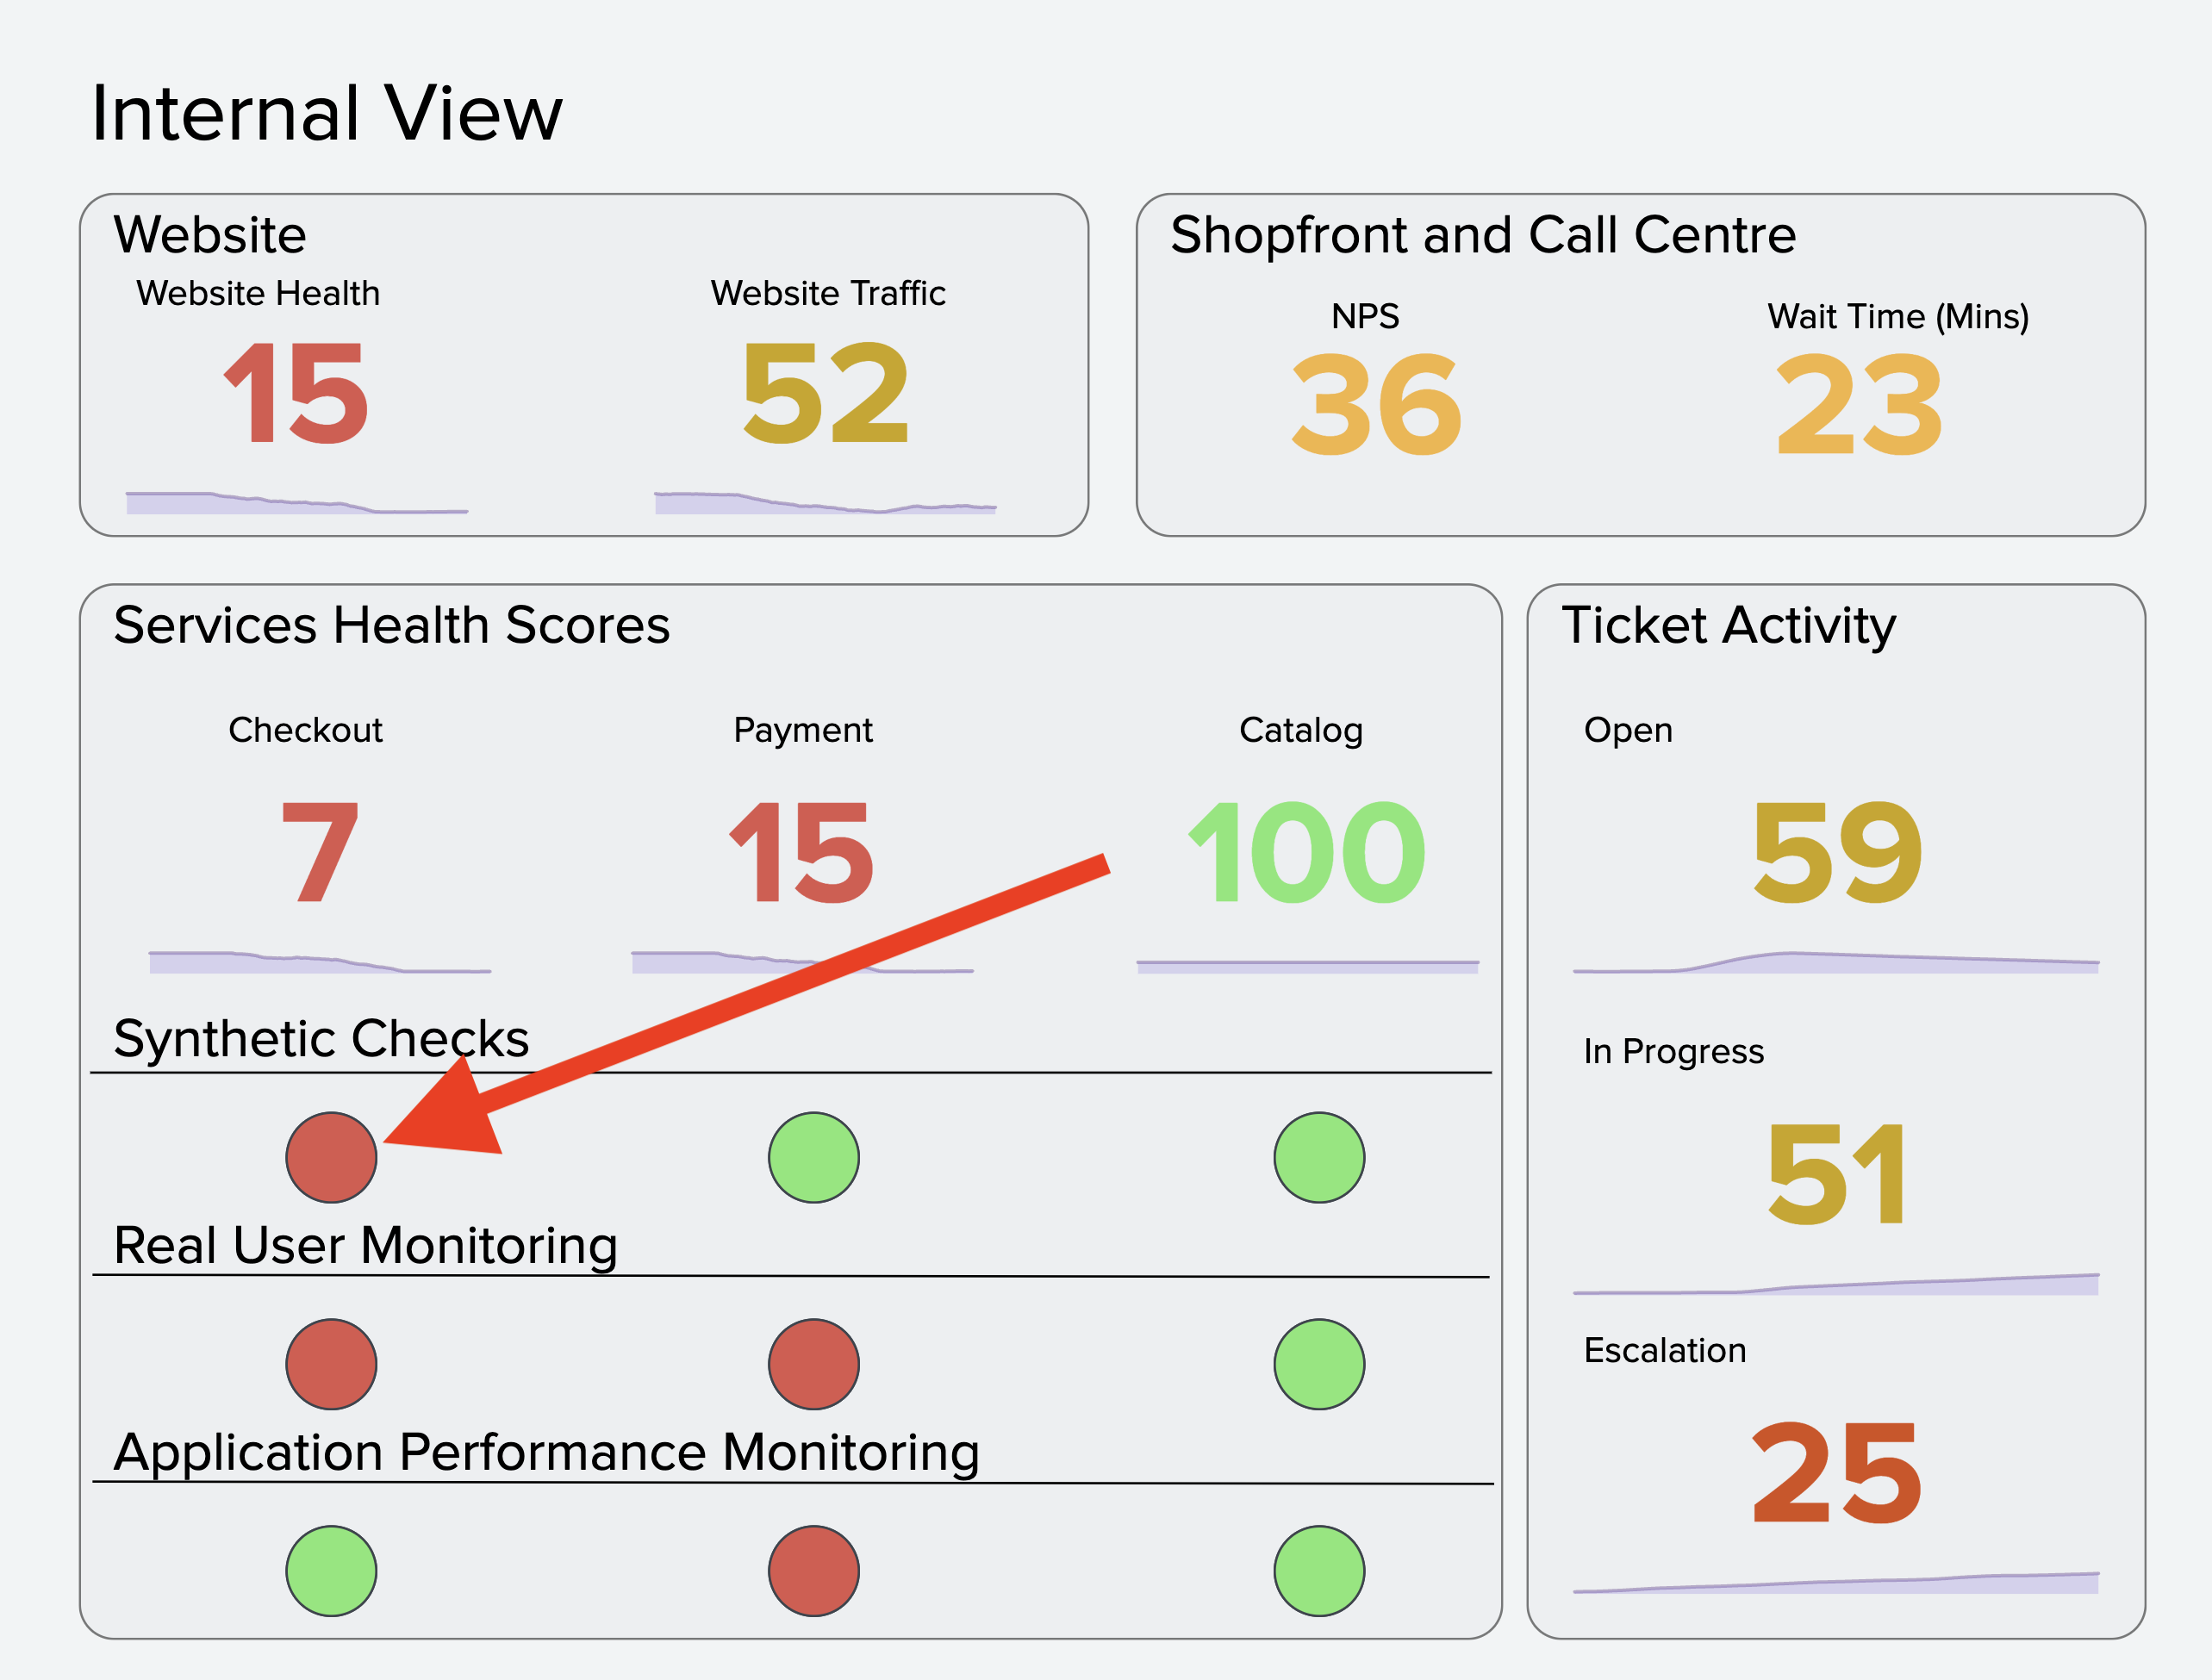
Kai opens Splunk IT Service Intelligence (ITSI) and navigates to a glass table that monitors service health. The glass table shows service health scores that update in real time.
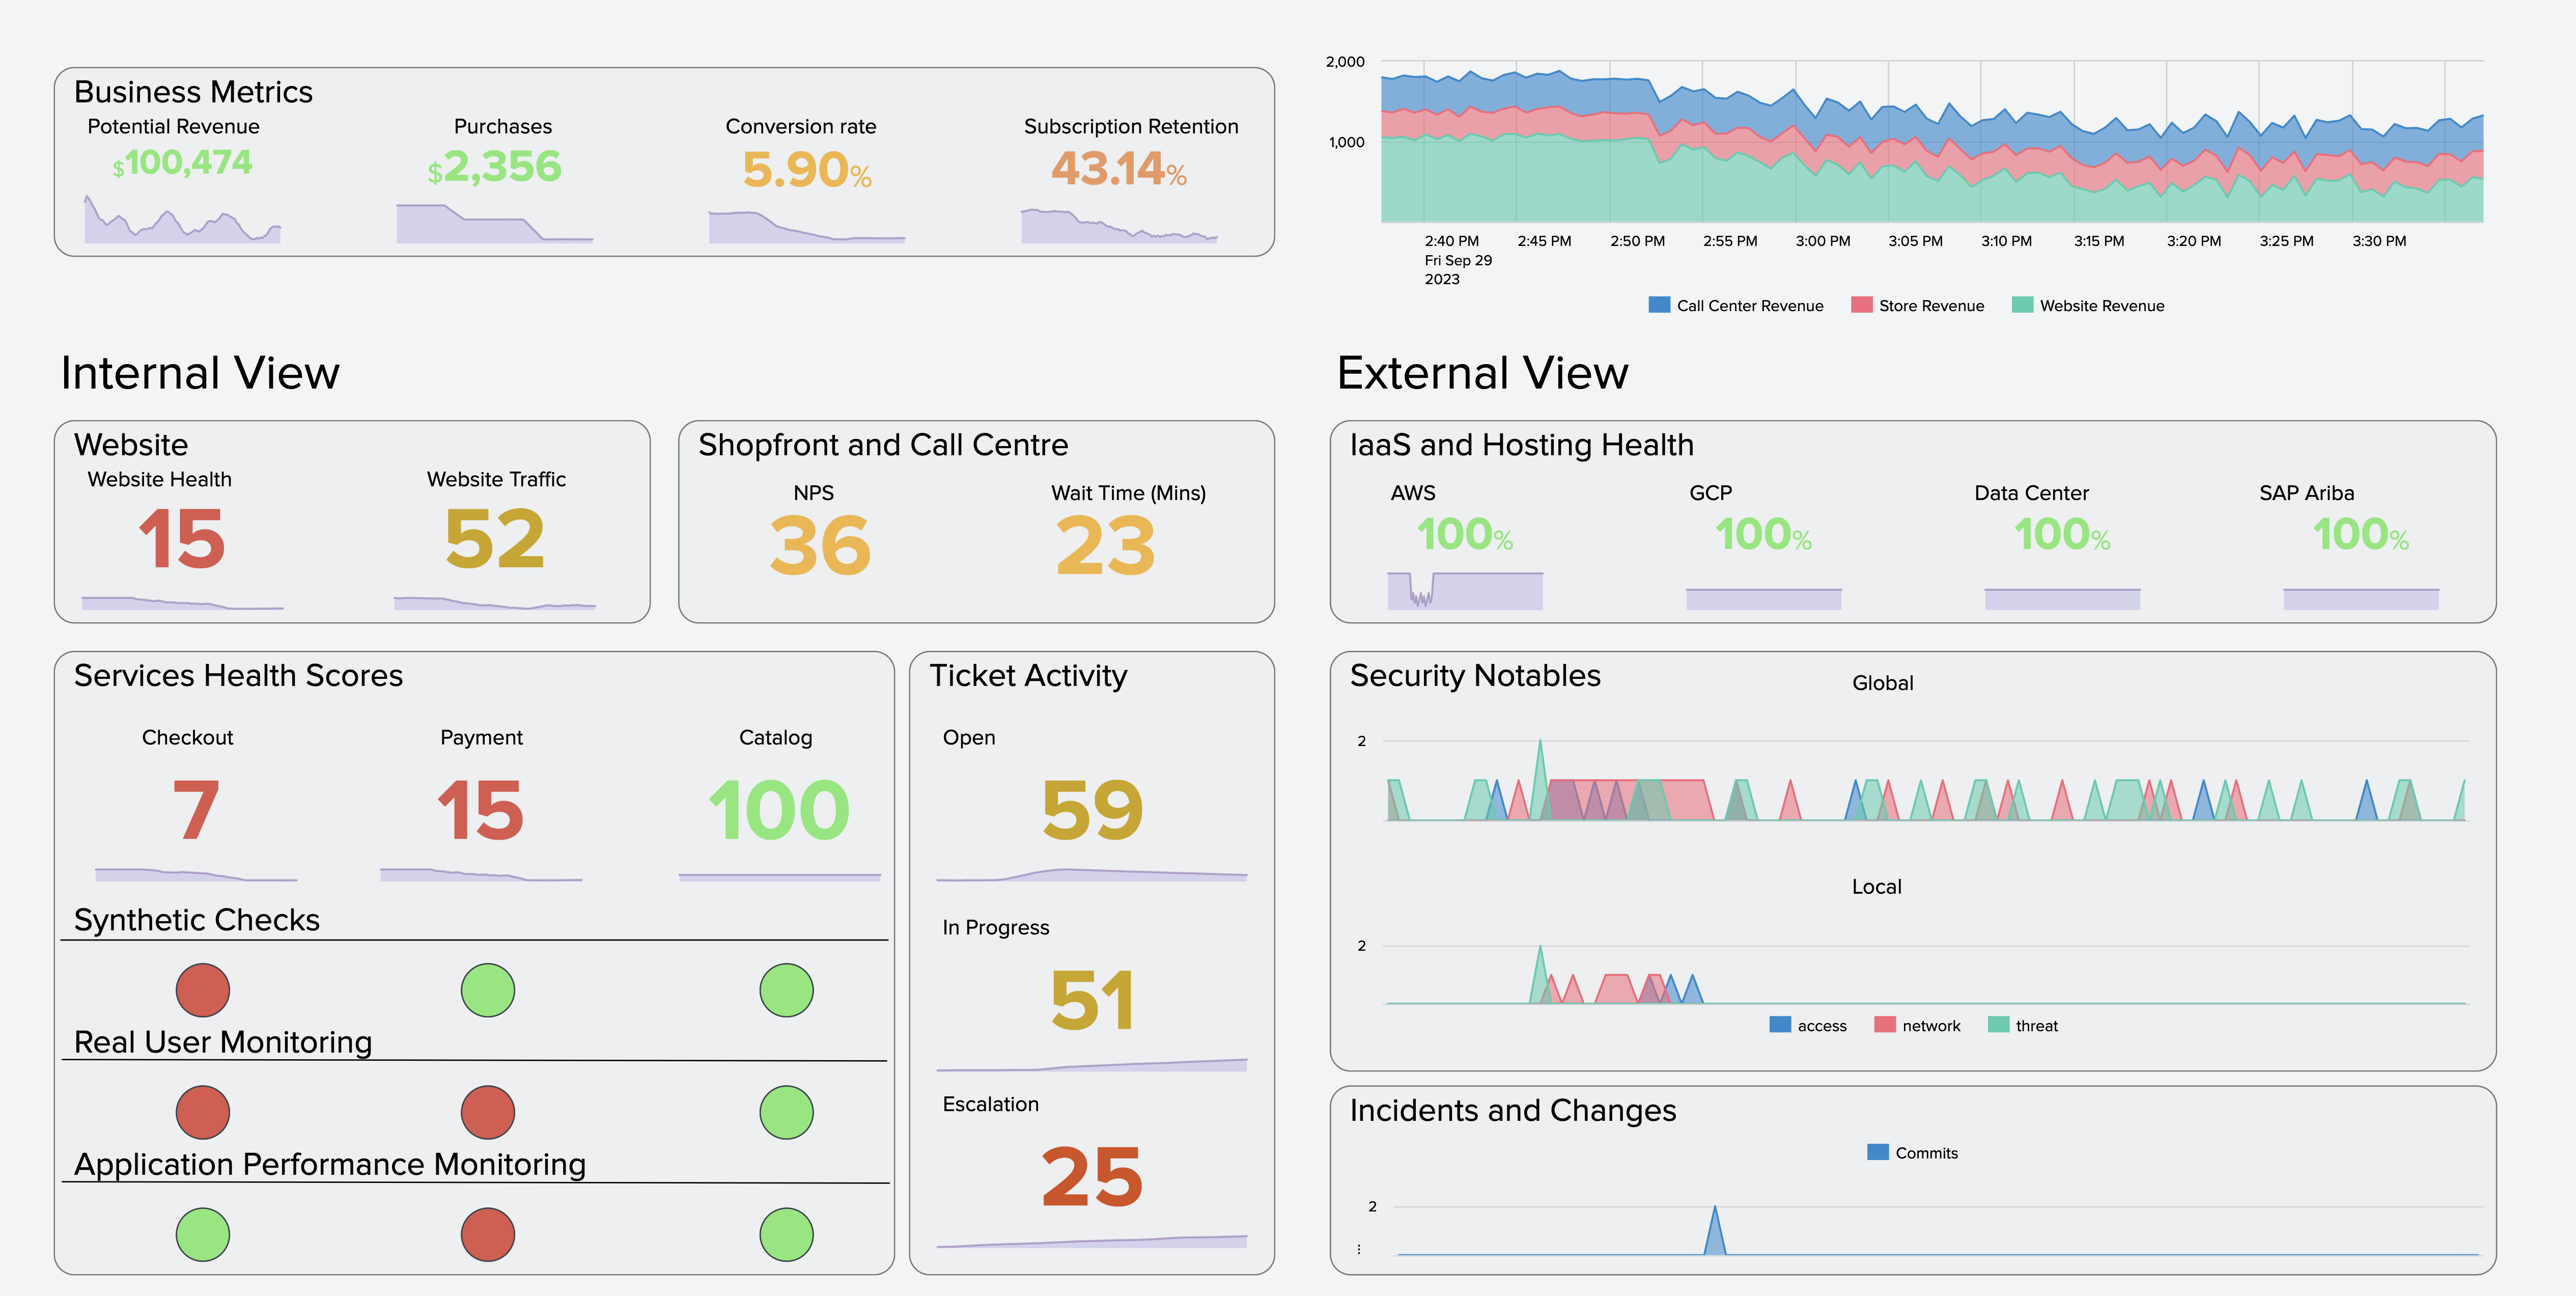
In the Services Health Scores section of a glass table, Kai sees red dots under Synthetics Checks and Real User Monitoring under the Checkout service, indicating poor health. Kai also sees poor health indicators under Real User Monitoring and Application Performance Monitoring for the Payment service. Kai begins the investigation by selecting the red dot under Synthetics Checks for the Checkout service, which prompts Synthetics to open in Splunk Observability Cloud.
Troubleshoot using Splunk Observability Cloud 🔗
In Splunk Observability Cloud, Kai troubleshoots the problem they first identified in ITSI by using the Synthetic Monitoring and Application Performance Monitoring (APM) views.
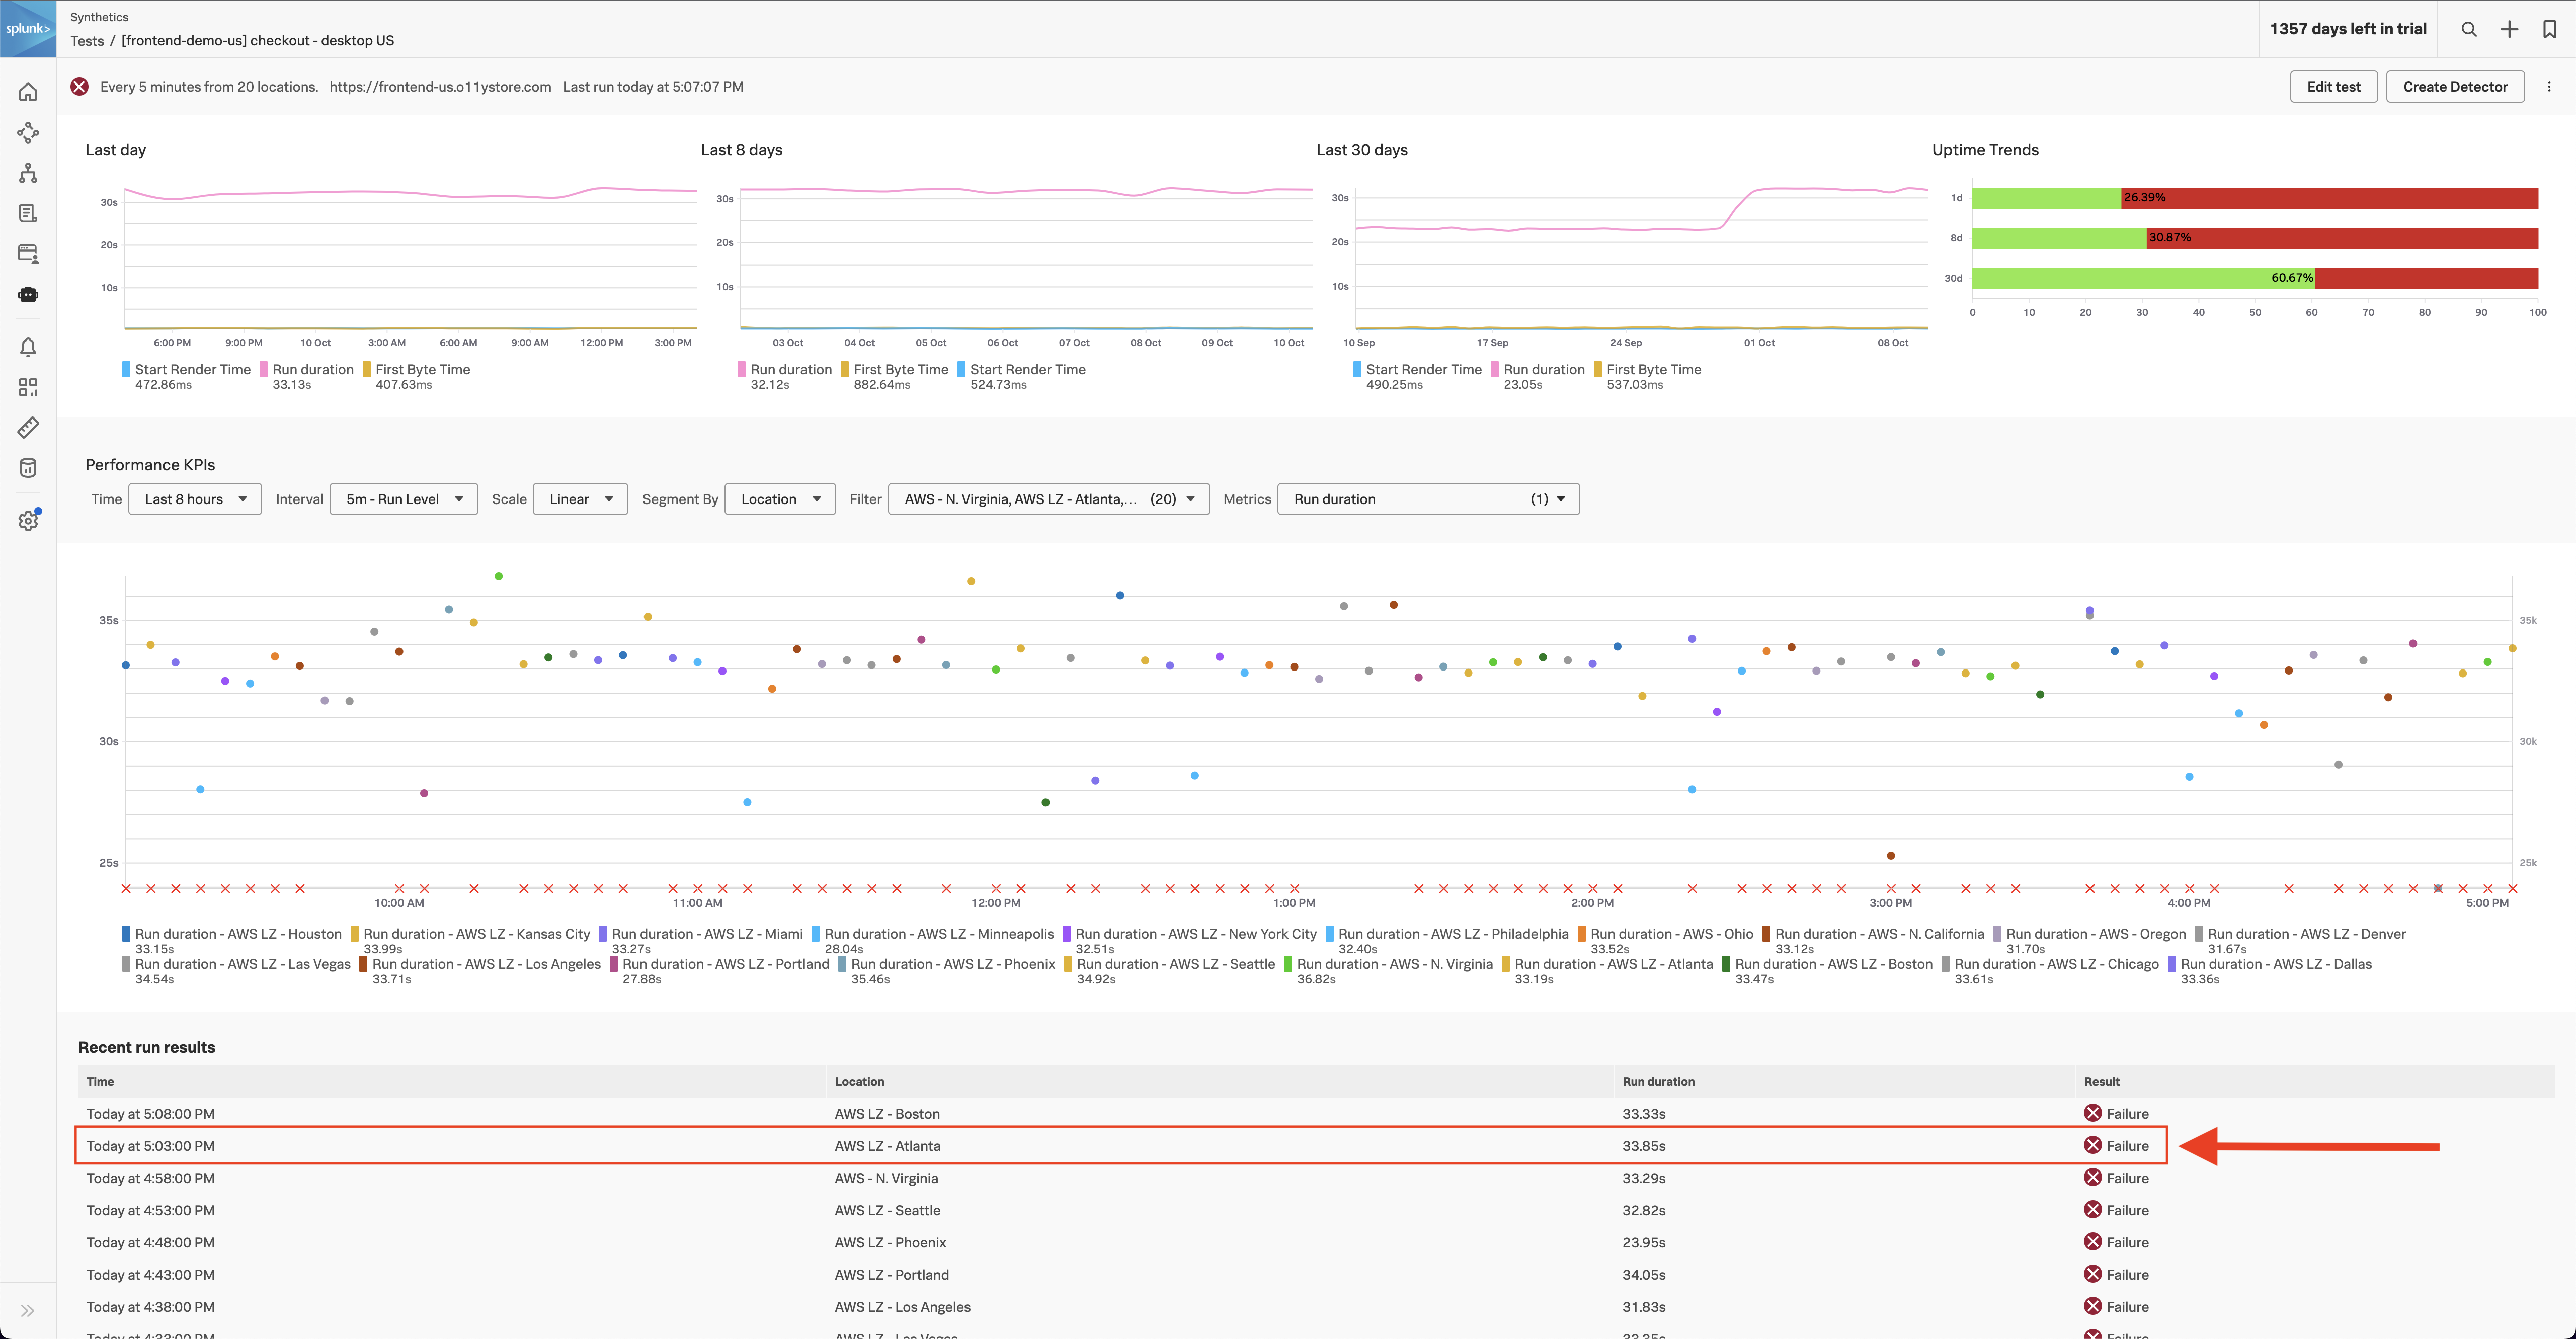
Examine synthetics tests in Splunk Synthetic Monitoring 🔗
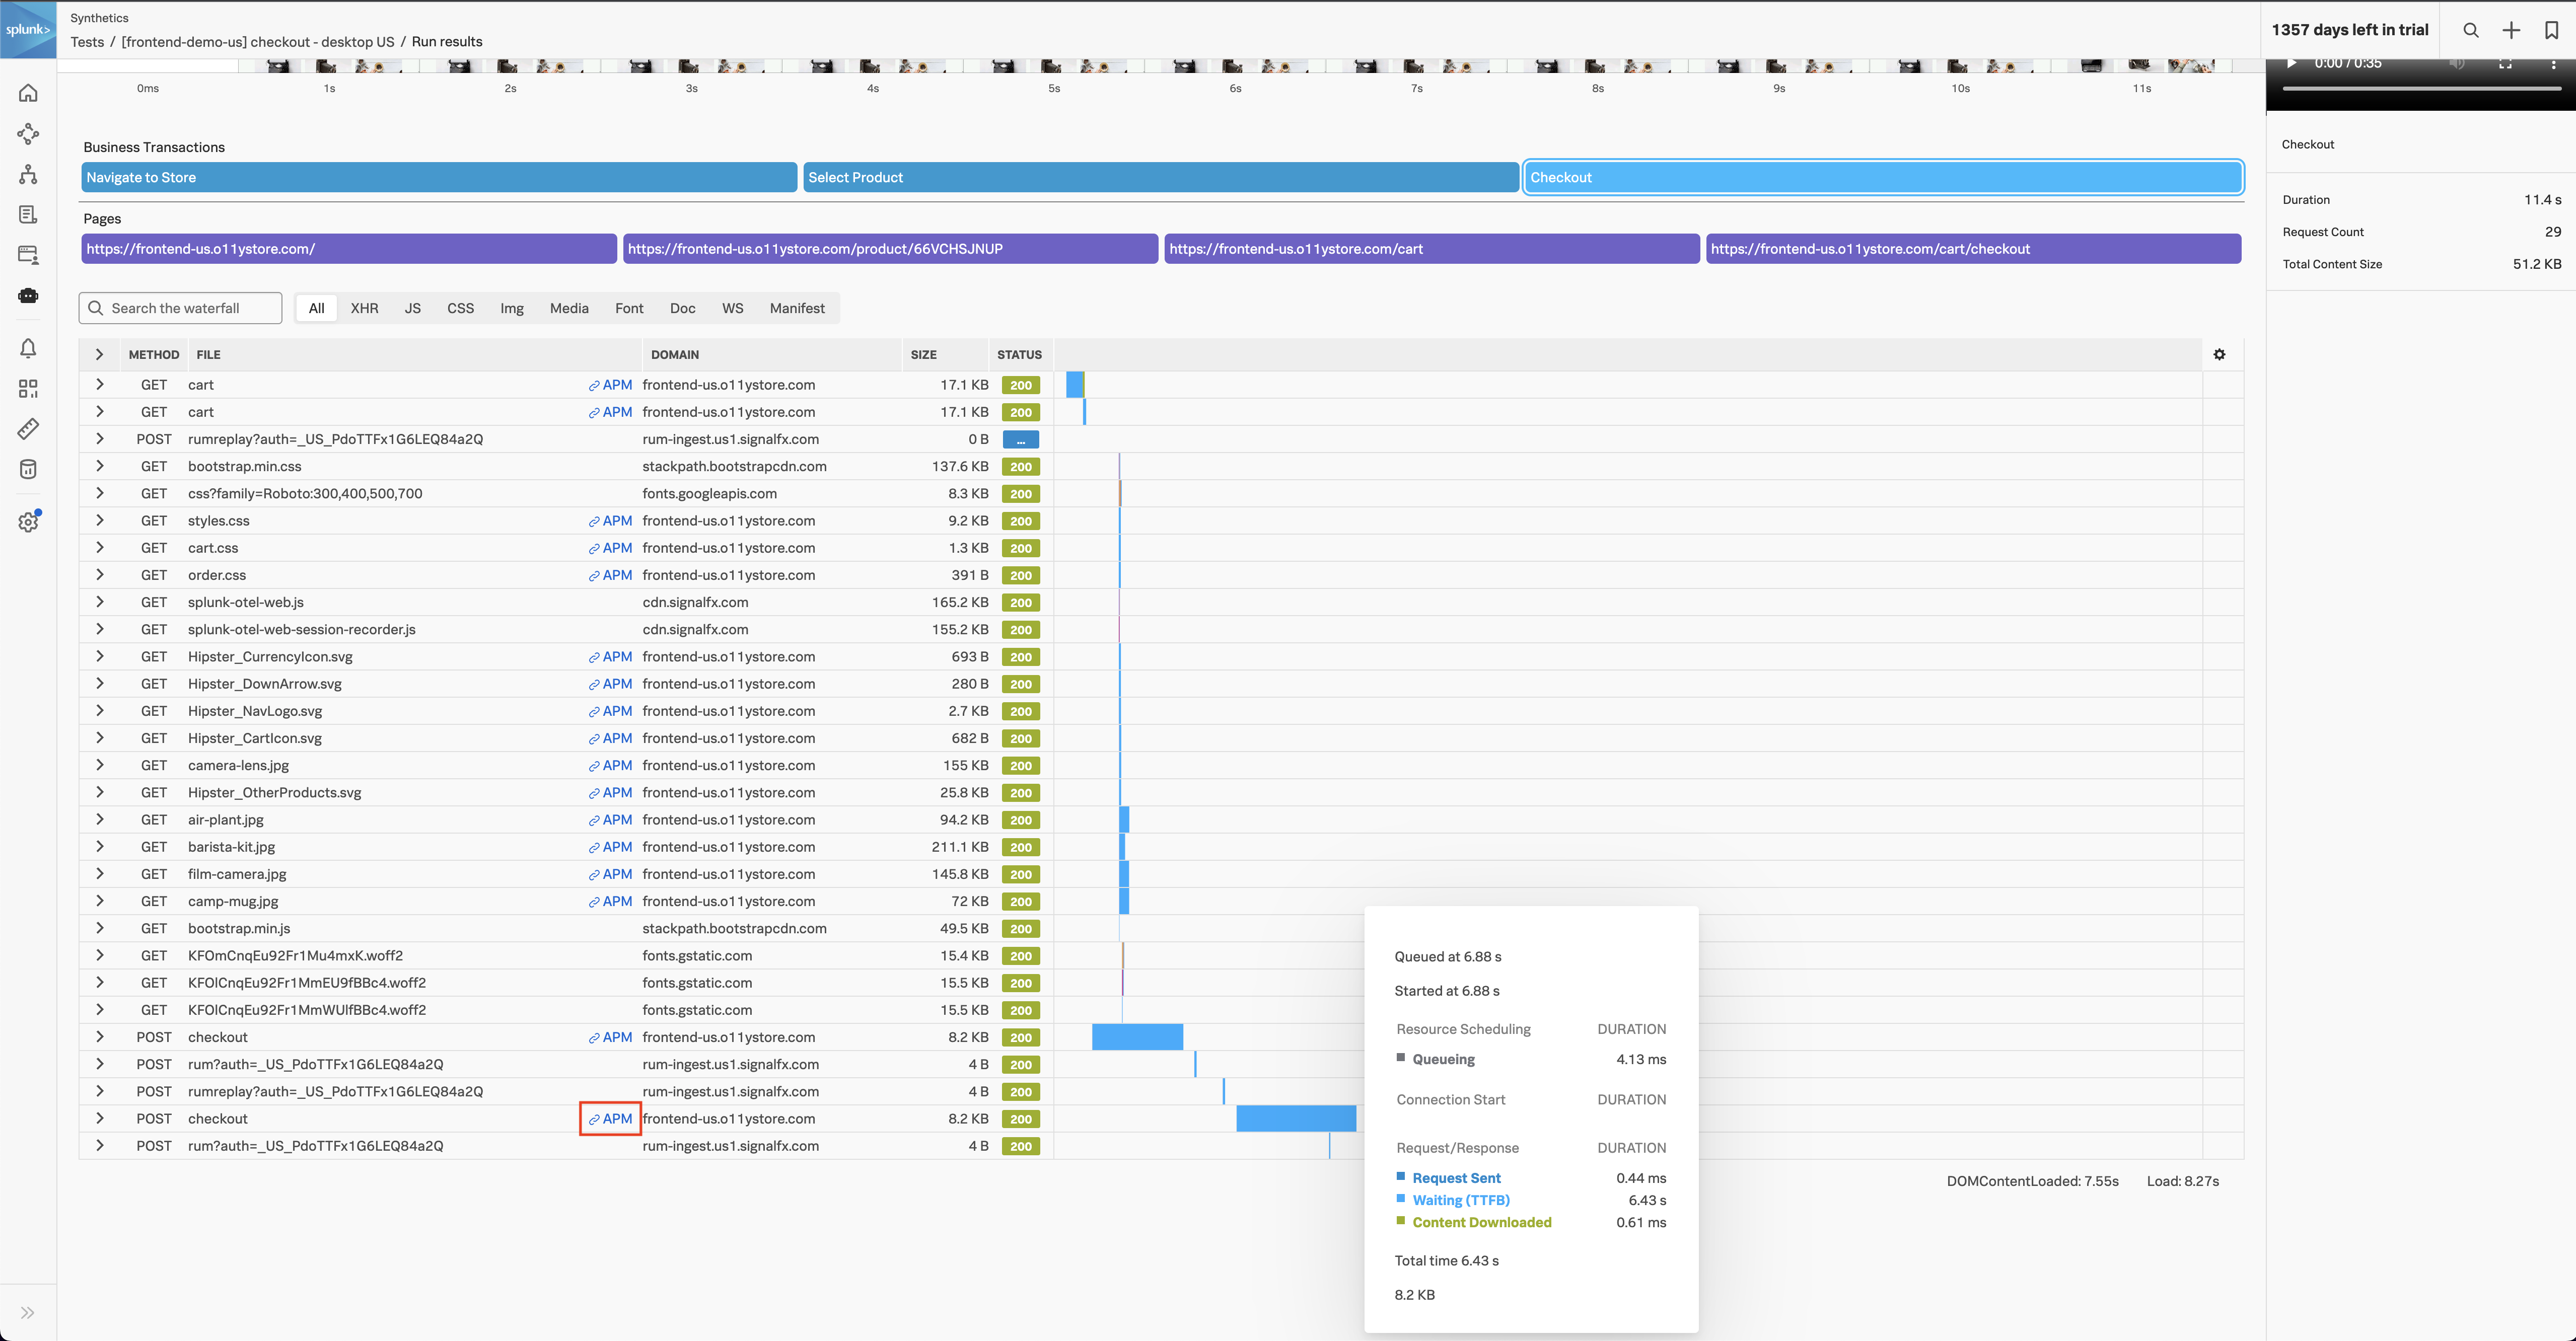
In the Synthetics view, Kai opens one of the failed tests then scrolls down to the recent run results section and opens one of the results. Kai notices that Splunk tracks the front-end service of each element of the Online Boutique website. Splunk also tracks the visual experience of the end-to-end customer journey so that Kai can replay it in a video capture to see what customers are seeing.
Kai plays the video capture in the upper right corner. The video capture shows that users attempt to make purchases, but checkout fails. The application delivers no error or feedback to the user, making it an unacceptable customer experience. Kai closes the video capture.
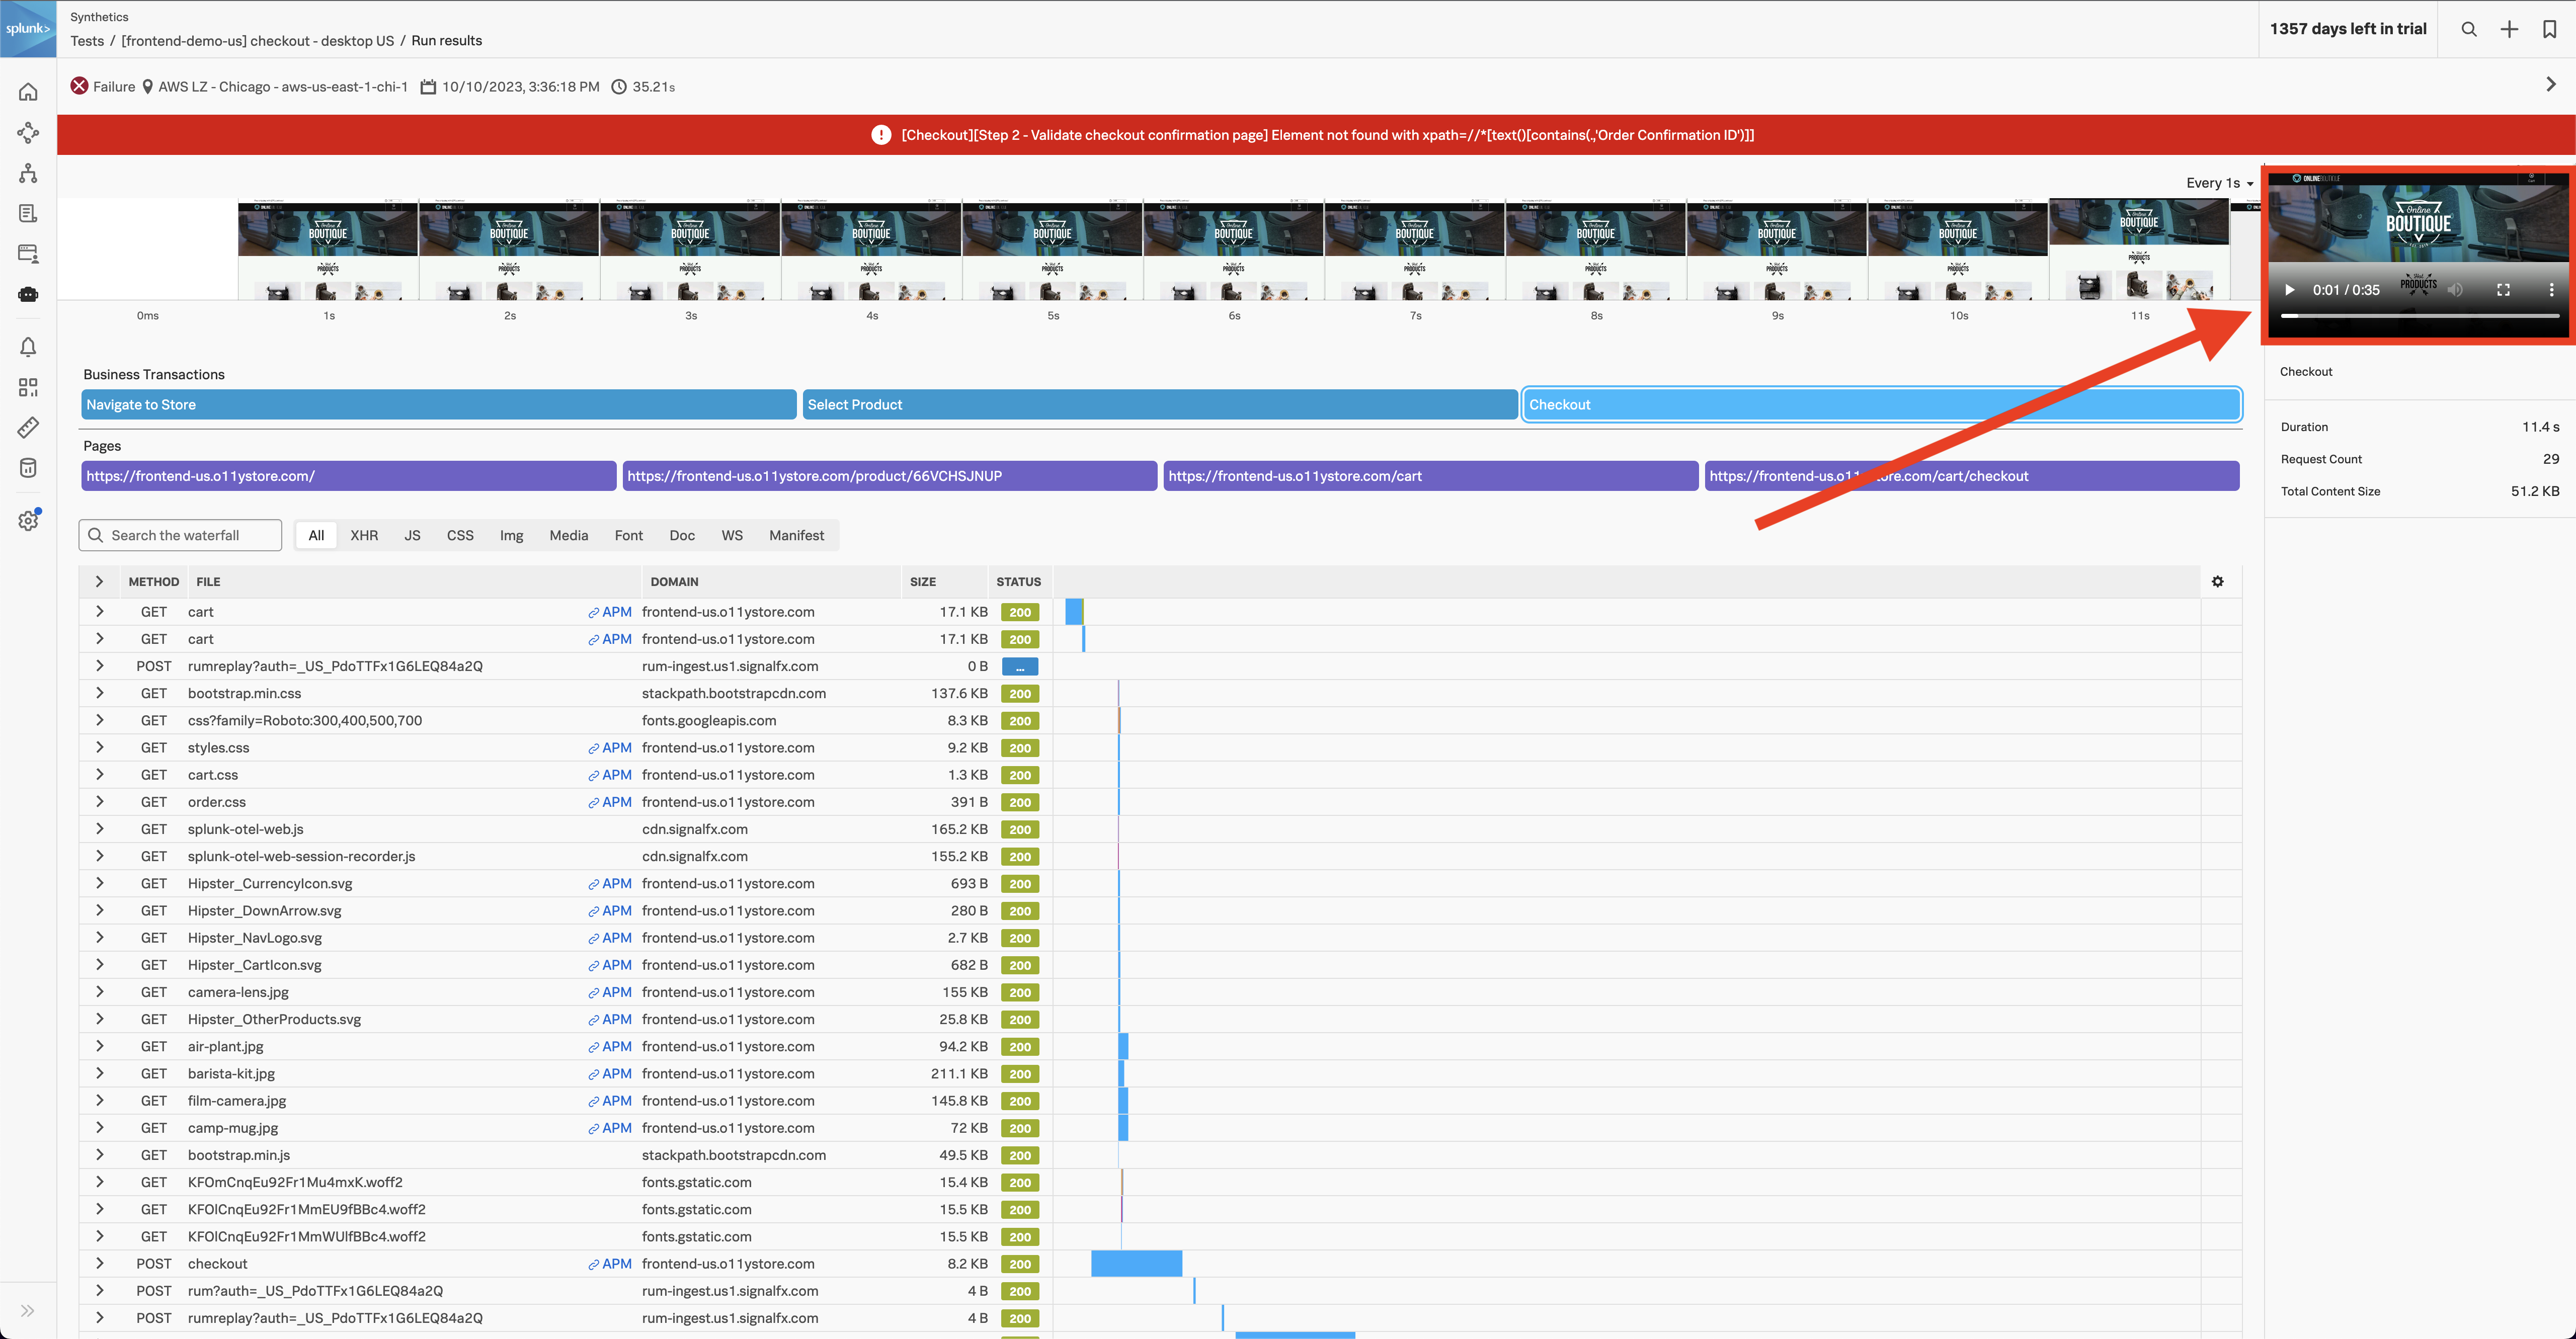
Kai selects the APM link next to the long checkout request to open Splunk APM where they can see which procedure calls are slow, which are stalled, and which failed. Kai can use Splunk APM full fidelity tracing to pivot to a reconstructed application map from the exact time of this issue or view a live service dependency map.
Investigate service dependencies in Splunk APM 🔗
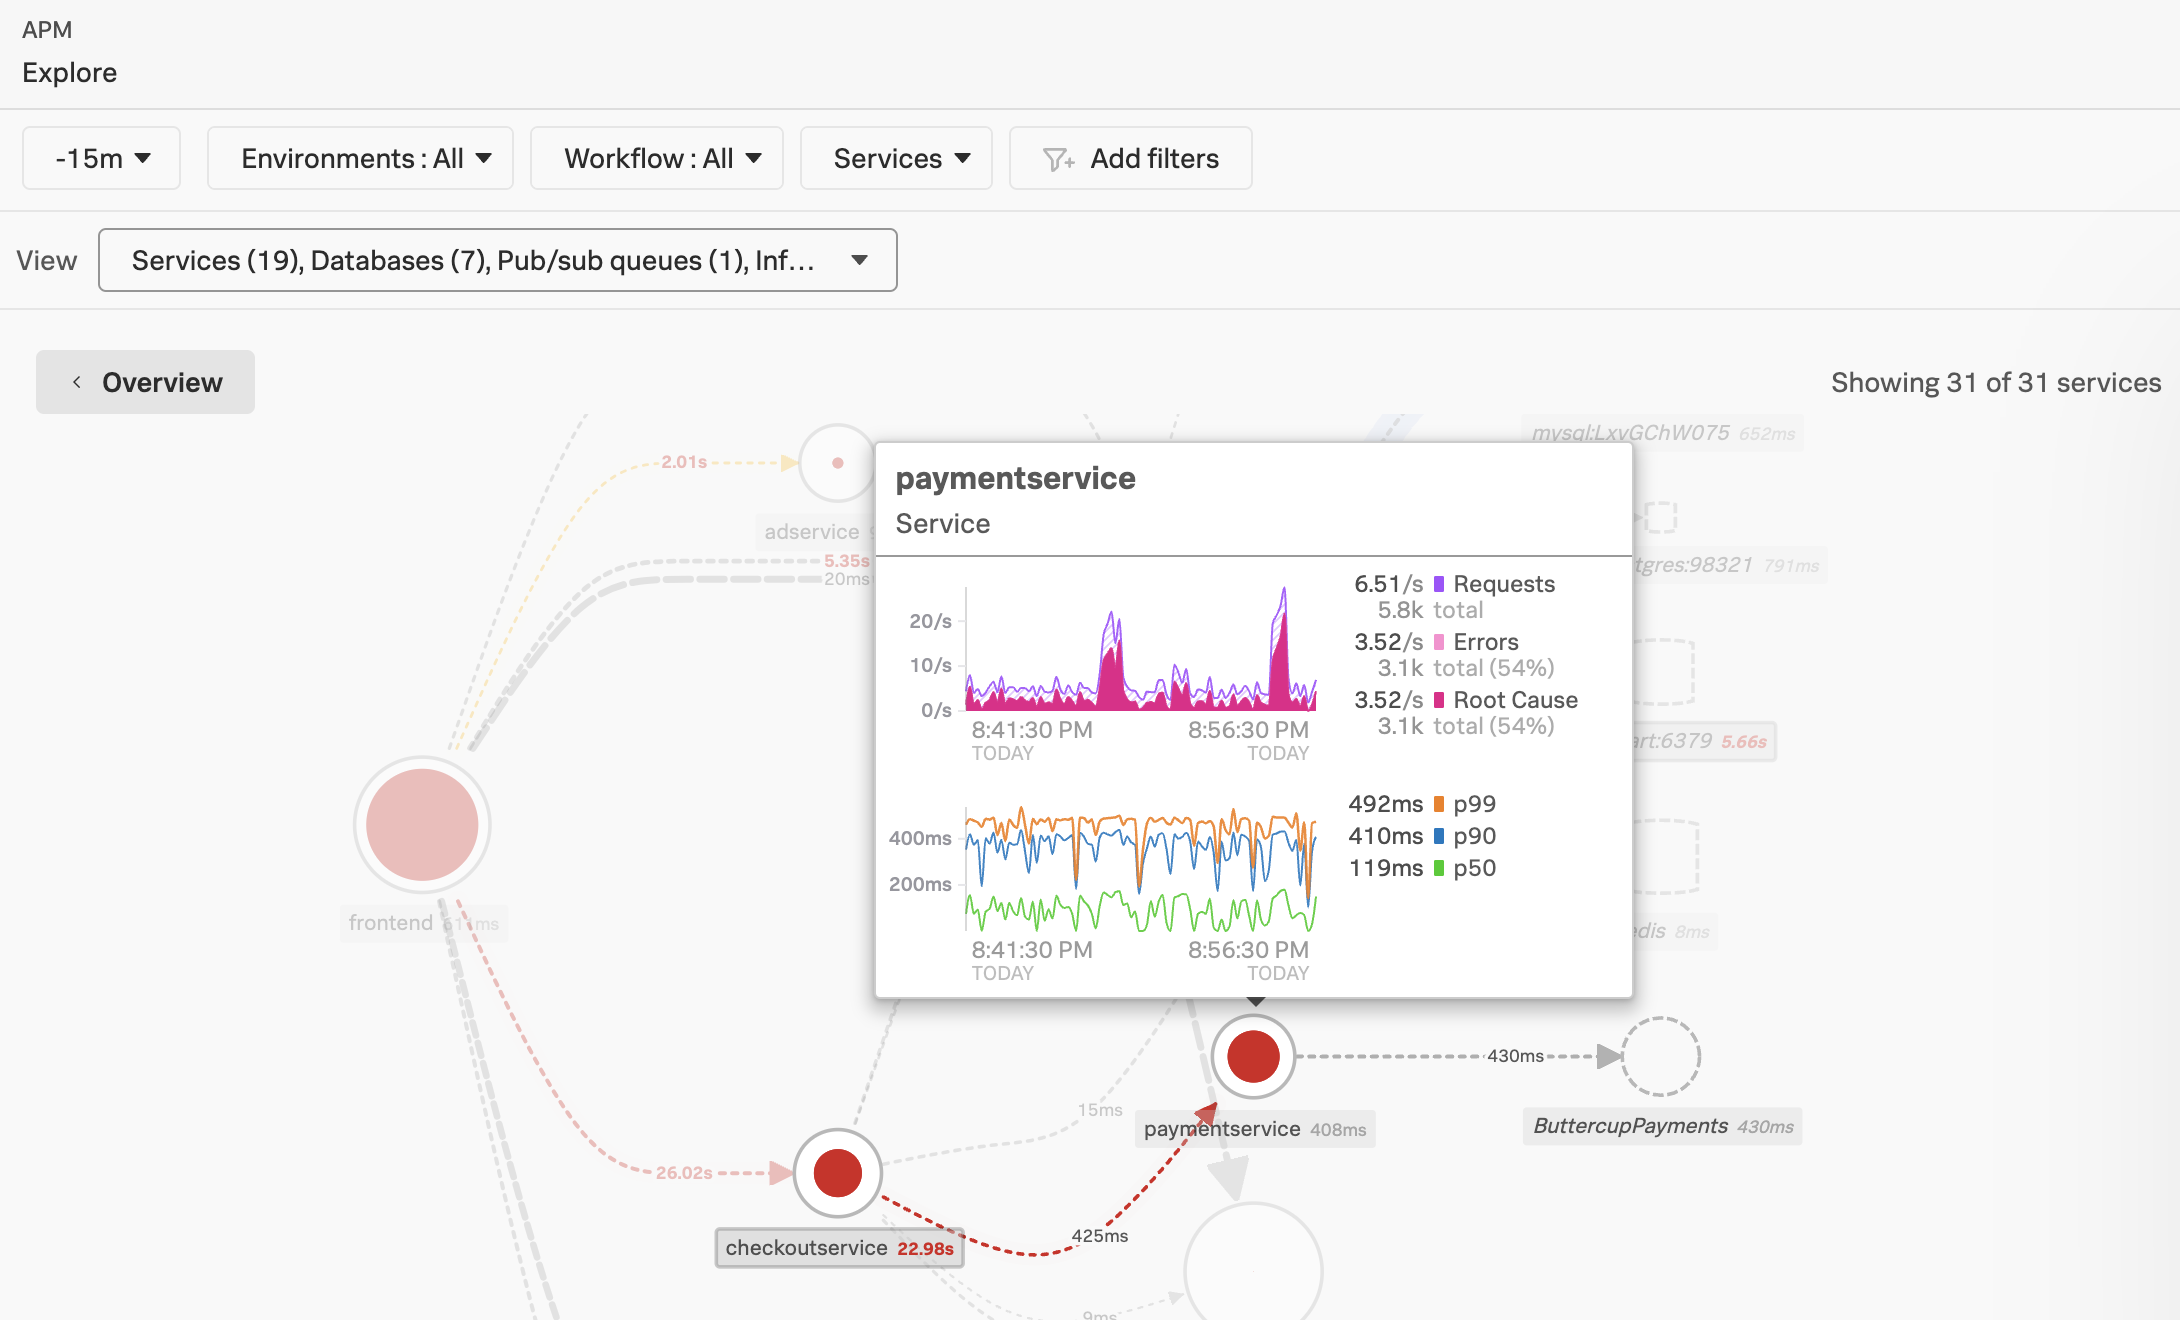
In Splunk APM, Kai chooses to go to a live service map. Kai sees red lines indicating slowness between the external clients and the payment service. Kai hovers over paymentservice and sees that it is responsible for many root cause errors.
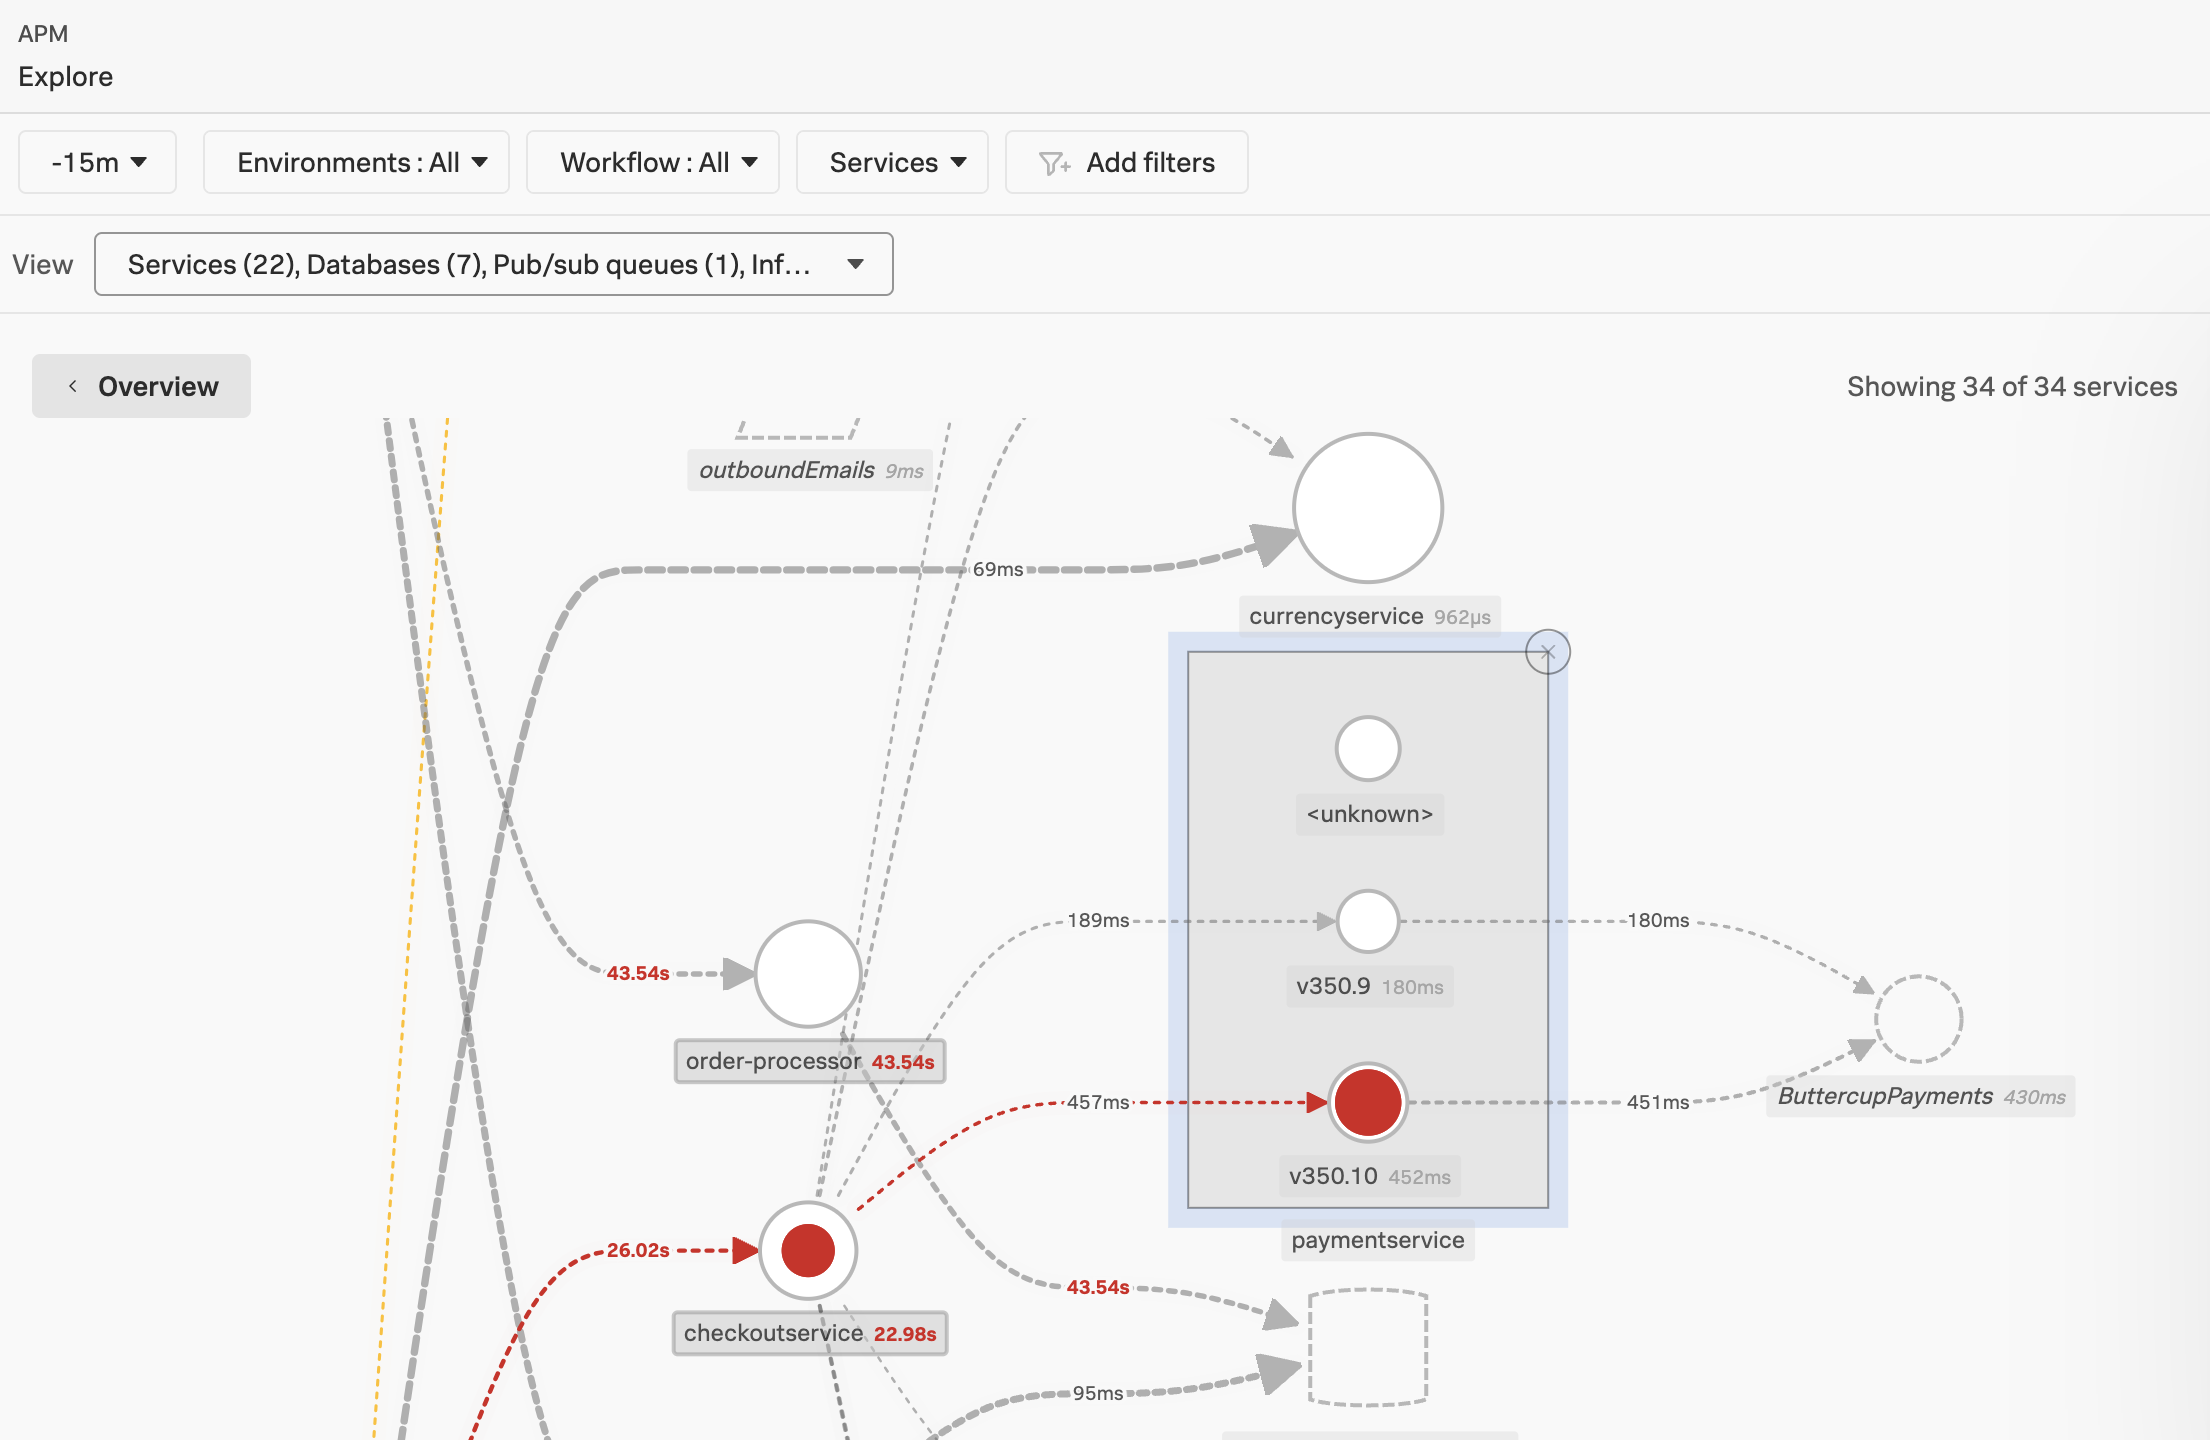
Kai selects paymentservice on the map to to split the payment service out by application version, revealing whether a recent code push might have negative impact on customers. On the right panel, Kai selects Breakdown then selects Version, then Errors. Sure enough, the new version of the code is causing all of the slowness and root cause errors. Kai lets the development team know that they should roll back the new version, v350.10.
After finding the source of the degraded revenue problem, Kai returns to the Splunk IT Service Intelligence glass table and is able to correlate the same application and business service with security notable events around the same time. Kai sees threat activity and some access and network activity right before that happened. They immediately report their findings to the Security team.