Filter and troubleshoot with custom tags 🔗
Create custom tags to improve filtering and troubleshooting capabilities in Tag Spotlight in Splunk RUM. First, create a custom span tag, then index it by adding a MetricSet to the span tag. Adding a MetricSet to a span tag gives you all of the features associated with indexed span tags.
Key concepts 🔗
How span tags, indexed span tags, and MetricSets relate to each other.
Span tags 🔗
Use span tags or processes to break down services and inter-service calls along trace characteristics or attributes. To get additional value from a span tag or process, an administrator can run an action known as indexing, which activates additional analysis of the indexed span tag or process. One benefit of indexing is to get aggregated metrics, called MetricSets, across all spans that contain a specified indexed tag or process.
MetricSets 🔗
MetricSets are metric time series (MTS) you can use to track the performance of specific metrics over time.
Default tags 🔗
The following tags are automatically indexed during ingestion by default depending on the metric:
URL name
operation
HTTP method and status code
custom event name
browser and version
OS name and version
city, region, country
Example: track custom processes 🔗
Adding your own tags that are meaningful to your organization like custom tags, helps you refine results and glean insights most pertinent to you. Custom span tags are especially useful for tracking processes that are unique to your organization.
Here are some examples of what you could use as span tags:
customer support tier or loyalty level
department
internal geo locations for facilities
branch locations
Add custom tags to Tag Spotlight 🔗
You need to be an admin to do this task. Follow these steps to add custom tags to Tag Spotlight:
Add a span tag as explained in Create a span. To add attributes to the span, see RUM’s API Methods.
There are two ways to navigate to the MetricSets configuration page. Choose either one:
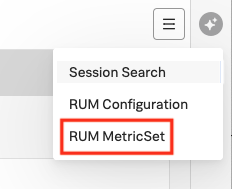
In Splunk RUM, select RUM MetricSet from the MetricSets configuration page as seen in the screenshot below.
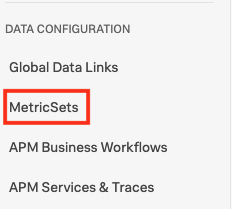
From the left navigation menu, select Settings, then MetricSets then the RUM tab.
Choose the tag you want to index to trigger the cardinality analyzer. If the cardinality check passes, select Add MetricSet and confirm with the check mark.
Troubleshooting 🔗
If the cardinality analysis fails, then you might have exceeded your entitlements.
Avoid high cardinality in MetricSets 🔗
Choose tags with a reasonable amount of cardinality. Tags like userID, or sessionID have high cardinality because there is a unique value for users in your organization and visitors to your application. Creating a troubleshooting MetricSet for each userID is not optimal for performance. For high-cardinality, ID-based tags, full-fidelity session search is a better option, see Filter your data by tags in Splunk RUM.
High cardinality MetricSets can also affect your org limits System limits for Splunk RUM. Limits are determined by your subscription: enterprise and standard. For more information on each type of subscription, see Splunk RUM Pricing .
This page was last updated on Dec 09, 2024.

