Get data into Splunk Observability Cloud 🔗
Use Splunk Observability Cloud to achieve full-stack observability of all your data sources, including your infrastructure, applications, and user interfaces. Splunk Observability Cloud includes the following solutions:
Splunk Synthetic Monitoring - Splunk Synthetic Monitoring does not have a data import component
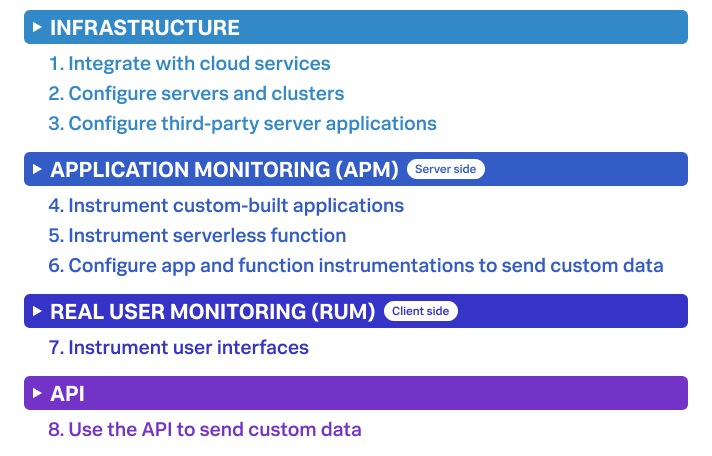
This guide provides 4 chapters that guide you through the process of setting up each component of Splunk Observability Cloud. The following diagram shows the step-by-step process of setting up each Splunk Observability Cloud component:
How to use this guide
You can set up each solution, or you can opt individual components to set up.
If you’re setting up all components, follow each part of each chapter in order. Otherwise, select the chapter or part you’d like to follow.