Part 3: Configure third-party server applications to send metrics, logs, and traces 🔗
After you’ve completed Part 2: Install the OpenTelemetry Collector to send server and cluster data and installed the Splunk Distribution of OpenTelemetry Collector on your servers (hosts) or in your clusters, configure the Collector’s native receivers or third-party applications, such as Apache, Cassandra, Hadoop, Kafka, and NGINX, to monitor your systems.
Configuring these systems doesn’t require any additional installation steps. Instead, you can use the Collector’s configuration files to add servers and applications.
Configure native receivers and third-party applications 🔗
Using the Collector’s native receivers, you can gather metrics, traces, and logs from sources such as MySQL, MongoDB, and Kafka. To configure these receivers, see Collector components.
You can also configure third-party applications to send data to Splunk Observability Cloud. For a list of these integrations, see Supported integrations in Splunk Observability Cloud.
View your data in Splunk Observability Cloud 🔗
After you’ve configured the Collector’s pipelines for your desired server applications, use one of the following methods to access your data:
If you can see your data in dashboards or in the metric finder, then your integration is working.
View metrics using built-in dashboards available for your server applications 🔗
Splunk Observability Cloud uses navigators to display information about server applications.
For example, the built-in Kafka dashboard shows visualizations for Kafka data:
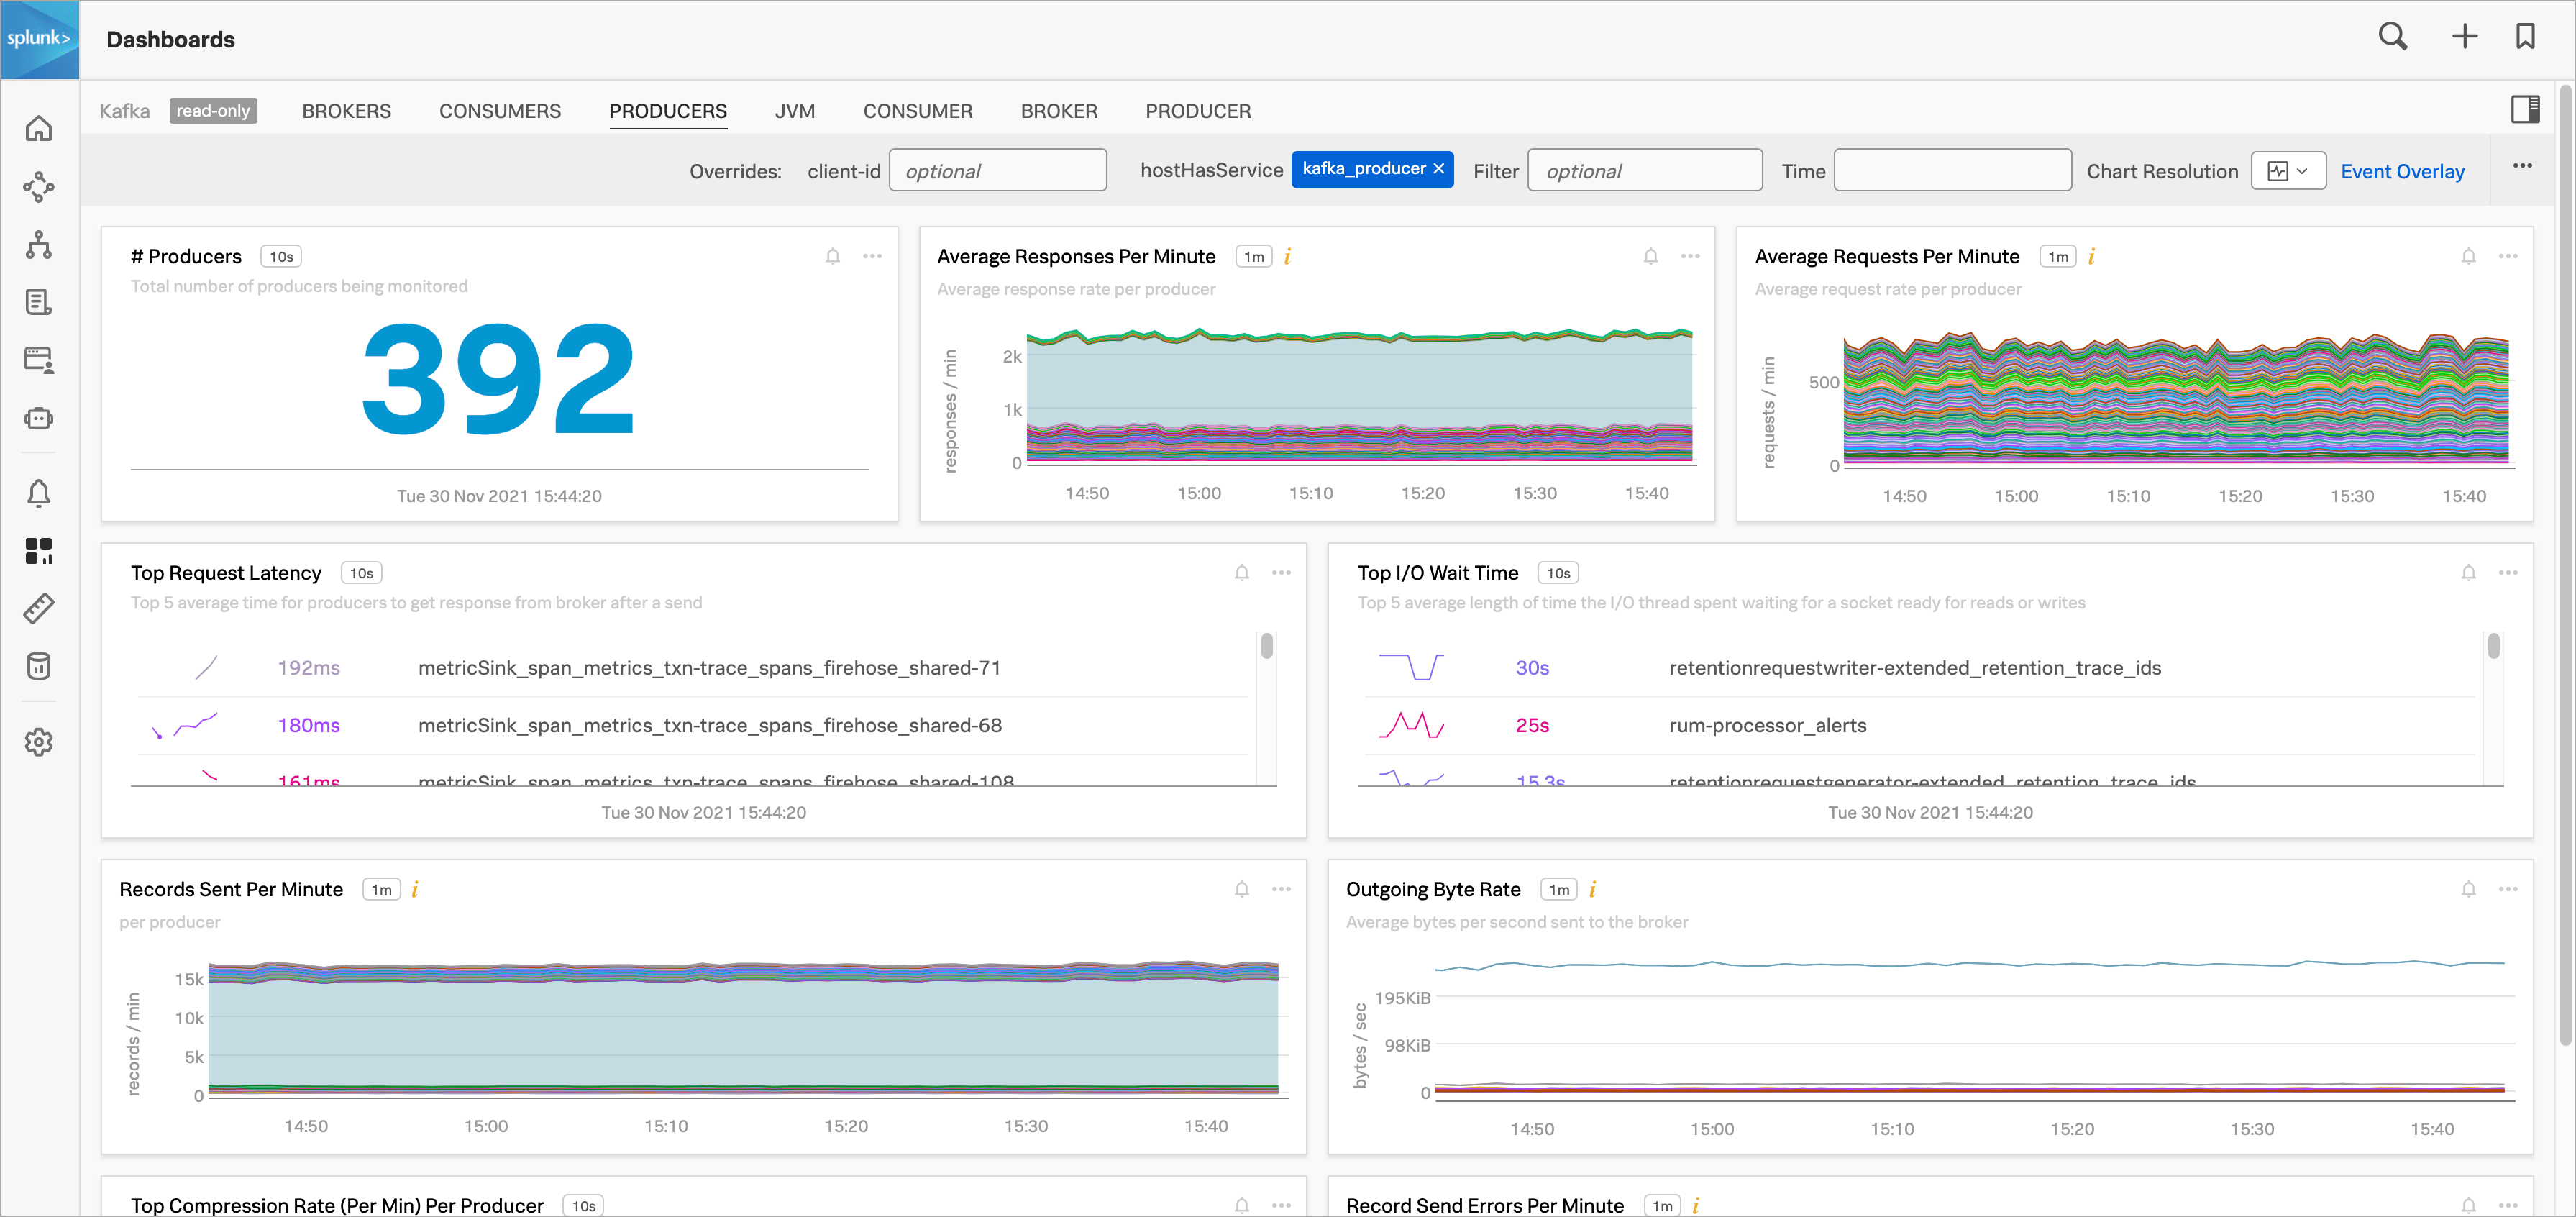
For more information about dashboards, see View dashboards in Splunk Observability Cloud.
Search for metrics using the metric finder 🔗
You can search for your server application metrics using the Splunk metric finder.
For the list of metrics provided by an application receiver, see the documentation for the application receiver.
For information about how to use the metric finder, see Search for metrics in the Metric Finder.
Query logs in Log Observer Connect 🔗
If you chose to ingest logs, you can query them in the Splunk Log Observer Connect. For more information, see View overall system health using the timeline.