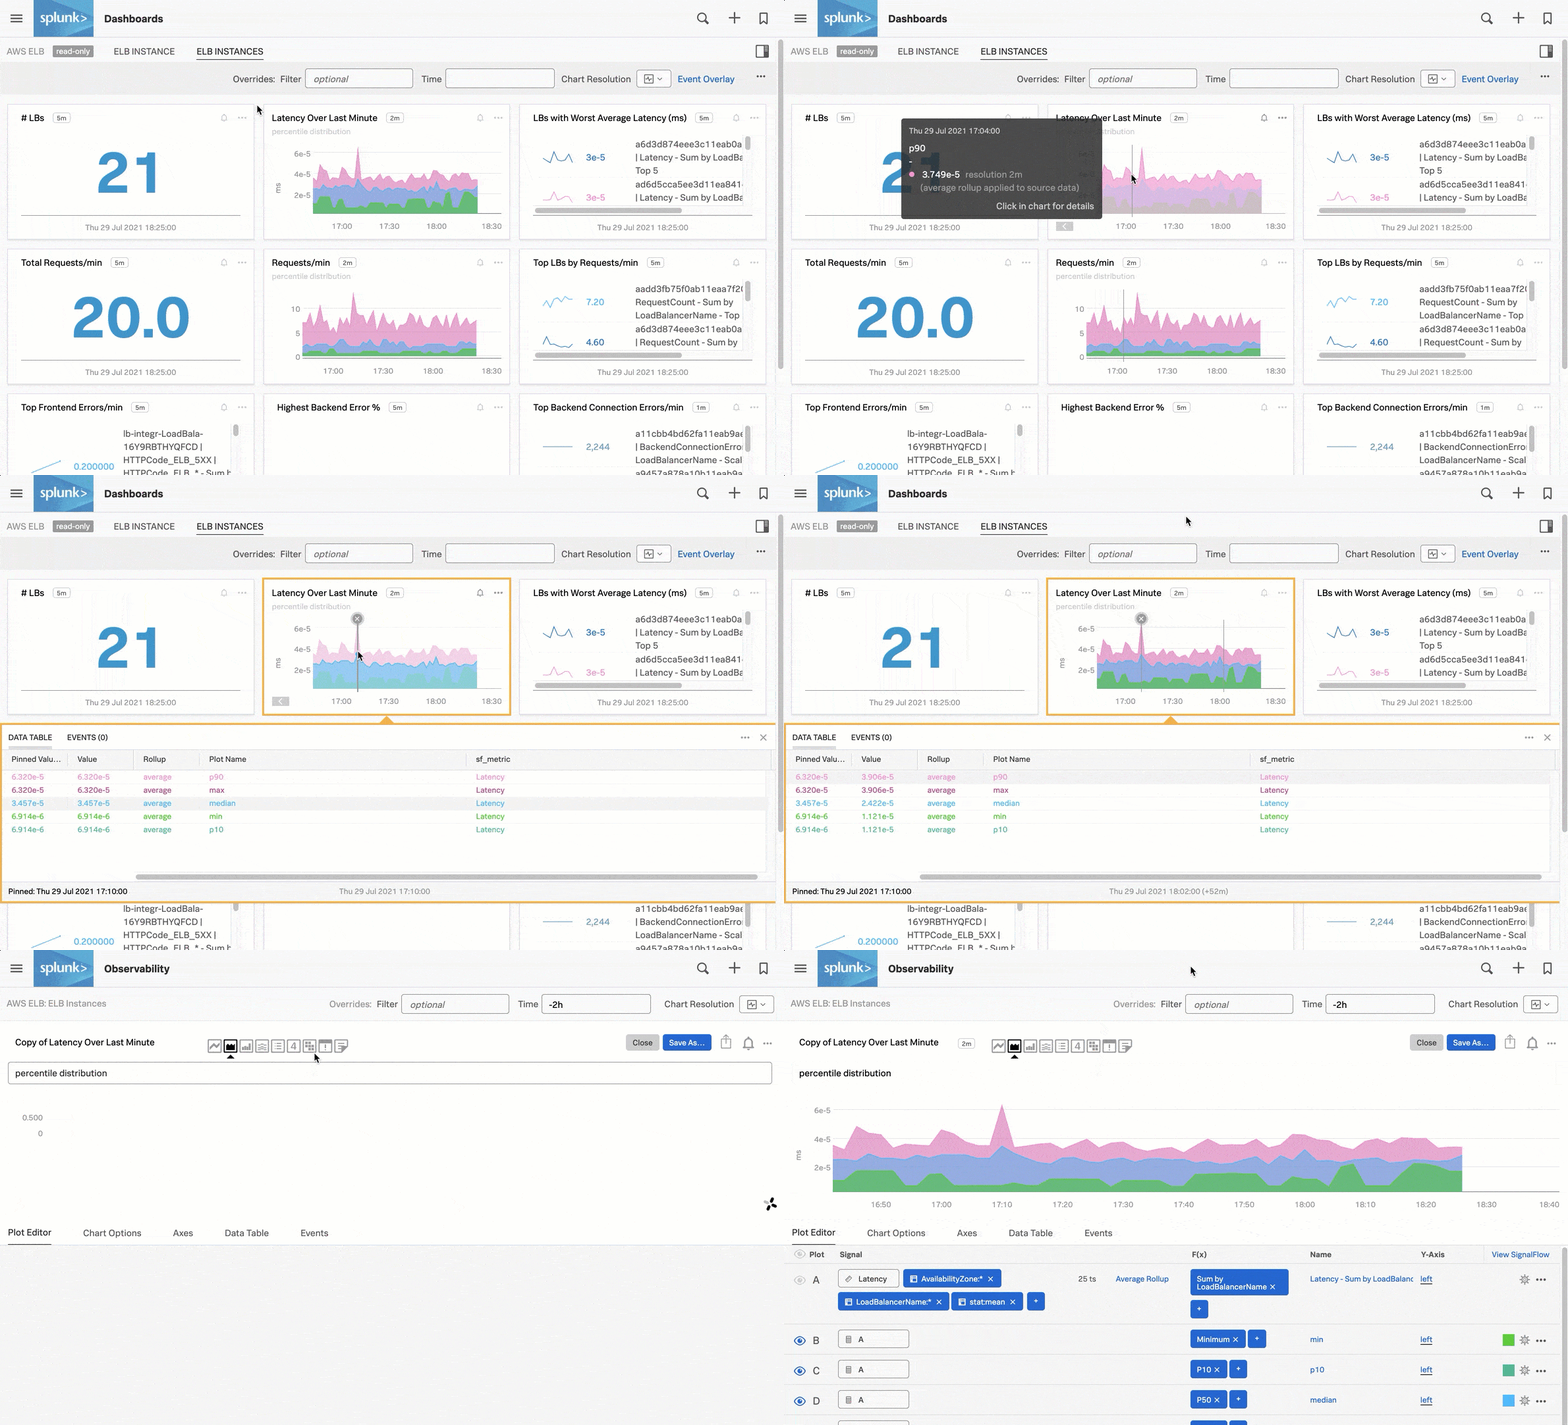
Chapter 1: Configure infrastructure and cloud services 🔗
The first step towards achieving full-stack observability is configuring infrastructure and cloud services to send data to Splunk Infrastructure Monitoring. By completing this phase of the onboarding process, you can get a detailed view of the platforms on which you run your services.

Infrastructure monitoring can help you solve a variety of problems related to your platform. For example, if you run a set of applications on a Kubernetes cluster, infrastructure monitoring can tell you when specific pods are failing.
Infrastructure monitoring can also show you when your hosts are running slow or using too much memory. Pairing other services such as APM and RUM with Infrastructure monitoring can give you a broader view of your environment and explain problems in your services that might not be visible from APM alone.
Getting started
If you’re setting up full-stack observability, follow each part of this guide in order:
Part 1: Configure your infrastructure and cloud services to send data to Splunk Observability Cloud
Part 2: Install the OpenTelemetry Collector to send server and cluster data
Part 3: Configure third-party server applications to send metrics, logs, and traces
Otherwise, select the most relevant part(s) to follow.
Note
You must complete part 2 of this chapter before starting part 3.