Synthetics built-in dashboards 🔗
The built-in dashboards show helpful metrics on your subscription usage, trends in your test data, and filter out the test metrics based on your organization. These built-in dashboards are a convenient way to answer questions like:
% of failed runs and run success rates by test
usage per organization on the volume of tests you run a month
total run counts
performance metrics and web vitals for Browser tests
Go to Synthetics built-in dashboards 🔗
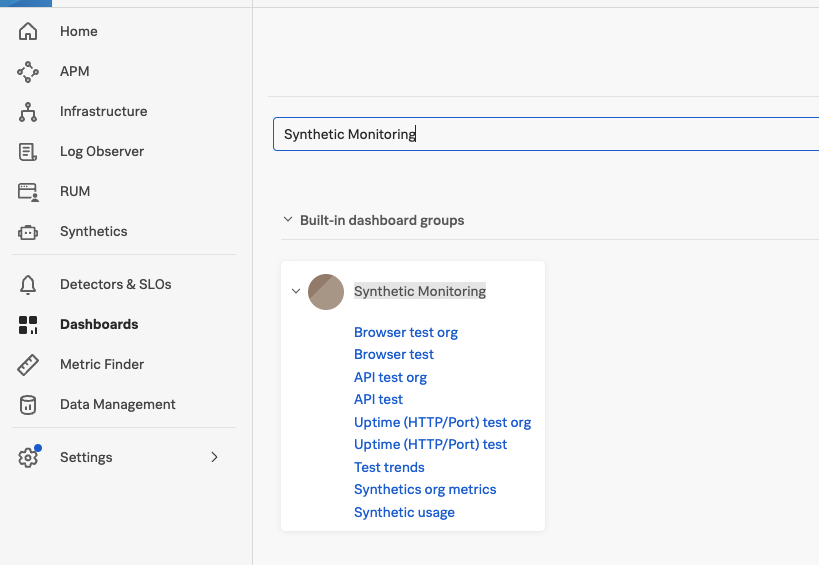
To find these dashboards, go to:
Select Dashboards.
Type in Synthetic Monitoring.
Choose the dashboard from the list what best suits your situation.
Here is the list of all the available dashboards:
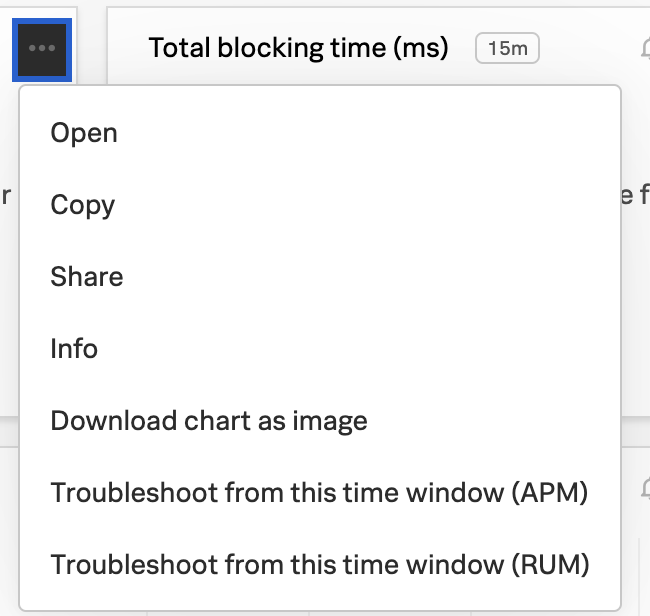
Troubleshoot an issue from a built-in dashboard 🔗
If you want to do additional troubleshooting and explore data from a built-in dashboard, select the settings symbol in any tile, then Troubleshoot from this time window in Splunk APM and Splunk RUM.
Dashboards for alerts and detectors 🔗
To create charts and dashboards for your Synthetics alerts and detectors, see: