Link detectors to charts 🔗
Detectors constantly monitor signals for conditions or issues, triggering alerts when needed. When you link detectors to charts, you can discover and diagnose issues at a glance from your dashboards. If you create a new detector from a chart, a link to the new detector is automatically added to the chart.
Linked detectors color the border of the charts, tables, and icons with the color of the highest alert severity for all detectors linked to that chart. In the following example, the green border means there are no active alerts. If there is no border, then the chart has no linked detectors.

Note
You can only link detectors to charts in custom or user dashboards.
Link a detector to a chart 🔗
When you create a new detector, you can link the detector to a chart for more visibility into alerts based on the chart data.
Open the Detector menu (bell icon) for a chart in a dashboard or from the Chart Builder, then select .
Depending on the plots in the chart, you might see one or more related detectors.
Select a detector from the list to link it to the chart.
If you don’t see a related detector that you want to link, select to open the Chart Builder and enter the detector’s name.
Note
Selecting the Link detector button in the Chart Builder has identical functionality to selecting Choose detector to link.
Unlink a detector from a chart 🔗
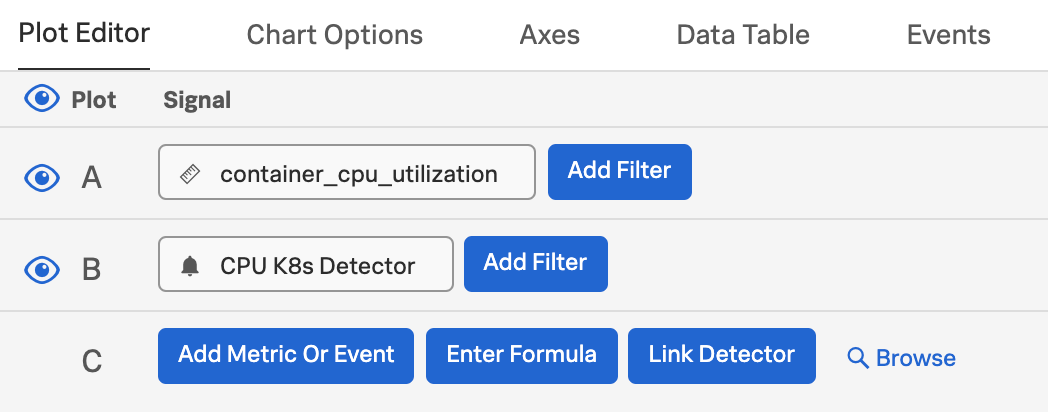
The black bell icon next to the linked detector name helps you differentiate linked detectors from other plot types in the Plot Editor.

To unlink the detector from the chart, select the more icon (⋯) and select from the menu.
View active alerts and linked detectors 🔗
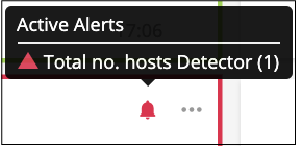
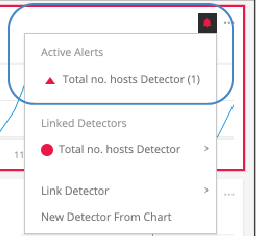
When you open the Detector menu for a chart in a dashboard or in the Chart Builder, you might see one or more active alerts, and one or more linked detectors that have already been linked to the chart.
List charts linked to a detector 🔗
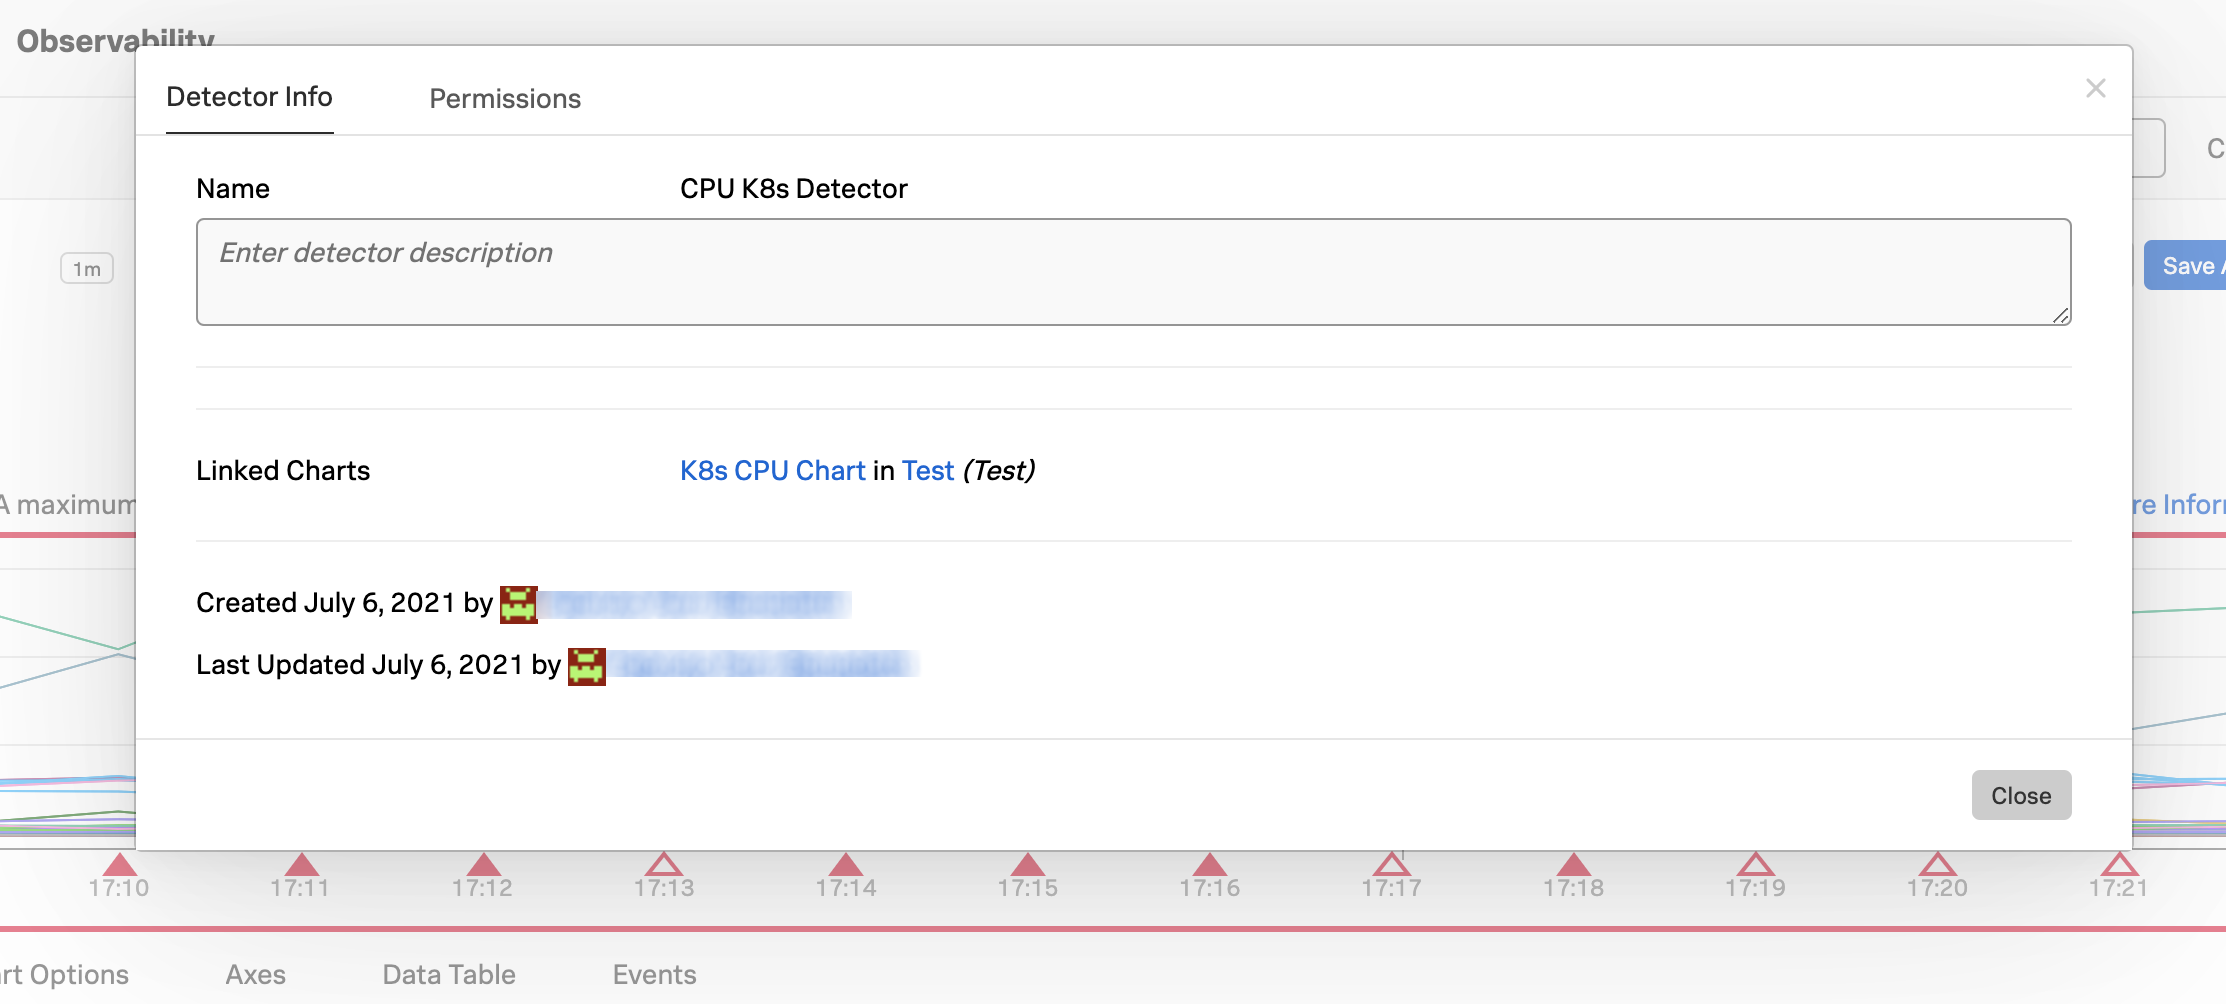
To view the linked detector information:
Select the Plot Editor tab of the Chart Builder.
Select the more icon (⋯).
Select .
The Detector Info dialog box lists all of the charts, with their dashboard name and group name for context, that are linked to the detector.


